PROTECTED SOURCE SCRIPT
TRADE ORBIT:-Andean Oscillator with Buy/Sell + Background
//=============================================================================
// DESCRIPTION
//-----------------------------------------------------------------------------
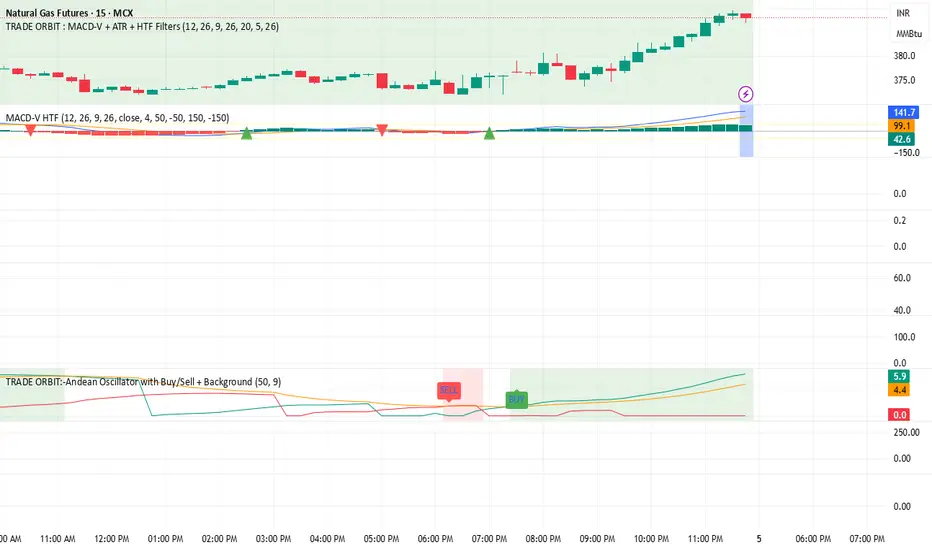
// The Andean Oscillator is a trend-momentum tool that compares bullish and
// bearish pressure using dynamic envelopes derived from price. It evaluates
// the strength of upward vs downward movement and generates trade signals
// when bullish or bearish momentum aligns above a smoothed signal line.
//
// COMPONENTS
// -----------
// • Bull : Represents bullish pressure
// • Bear : Represents bearish pressure
// • Signal: EMA smoothing of the stronger of Bull/Bear
//
// SIGNAL LOGIC
// -------------
// ✅ BUY signal is generated when:
// 1) Bull crosses above Bear
// 2) Bull then crosses above the Signal line
//
// ✅ SELL signal is generated when:
// 1) Bear crosses above Bull
// 2) Bear then crosses above the Signal line
//
// BACKGROUND COLORS
// -----------------
// • Green background → Bull > Bear and Bull > Signal
// • Red background → Bear > Bull and Bear > Signal
//
// PLOTS
// -----
// • Green plot → Bullish component
// • Red plot → Bearish component
// • Orange plot → Signal line
//
// ADDITIONAL NOTES
// ----------------
// • Uses envelope calculation with EMA smoothing
// • State-tracking ensures proper trend recognition
// • Alert conditions are included for Buy and Sell signals
//
//=============================================================================
// DESCRIPTION
//-----------------------------------------------------------------------------
// The Andean Oscillator is a trend-momentum tool that compares bullish and
// bearish pressure using dynamic envelopes derived from price. It evaluates
// the strength of upward vs downward movement and generates trade signals
// when bullish or bearish momentum aligns above a smoothed signal line.
//
// COMPONENTS
// -----------
// • Bull : Represents bullish pressure
// • Bear : Represents bearish pressure
// • Signal: EMA smoothing of the stronger of Bull/Bear
//
// SIGNAL LOGIC
// -------------
// ✅ BUY signal is generated when:
// 1) Bull crosses above Bear
// 2) Bull then crosses above the Signal line
//
// ✅ SELL signal is generated when:
// 1) Bear crosses above Bull
// 2) Bear then crosses above the Signal line
//
// BACKGROUND COLORS
// -----------------
// • Green background → Bull > Bear and Bull > Signal
// • Red background → Bear > Bull and Bear > Signal
//
// PLOTS
// -----
// • Green plot → Bullish component
// • Red plot → Bearish component
// • Orange plot → Signal line
//
// ADDITIONAL NOTES
// ----------------
// • Uses envelope calculation with EMA smoothing
// • State-tracking ensures proper trend recognition
// • Alert conditions are included for Buy and Sell signals
//
//=============================================================================
Mã được bảo vệ
Tập lệnh này được đăng dưới dạng mã nguồn đóng. Tuy nhiên, bạn có thể tự do sử dụng tập lệnh mà không có bất kỳ hạn chế nào – tìm hiểu thêm tại đây.
Thông báo miễn trừ trách nhiệm
Thông tin và ấn phẩm không có nghĩa là và không cấu thành, tài chính, đầu tư, kinh doanh, hoặc các loại lời khuyên hoặc khuyến nghị khác được cung cấp hoặc xác nhận bởi TradingView. Đọc thêm trong Điều khoản sử dụng.