PROTECTED SOURCE SCRIPT
Disparity Offset [WizardTrendsInc]
Disparity Offset
Description
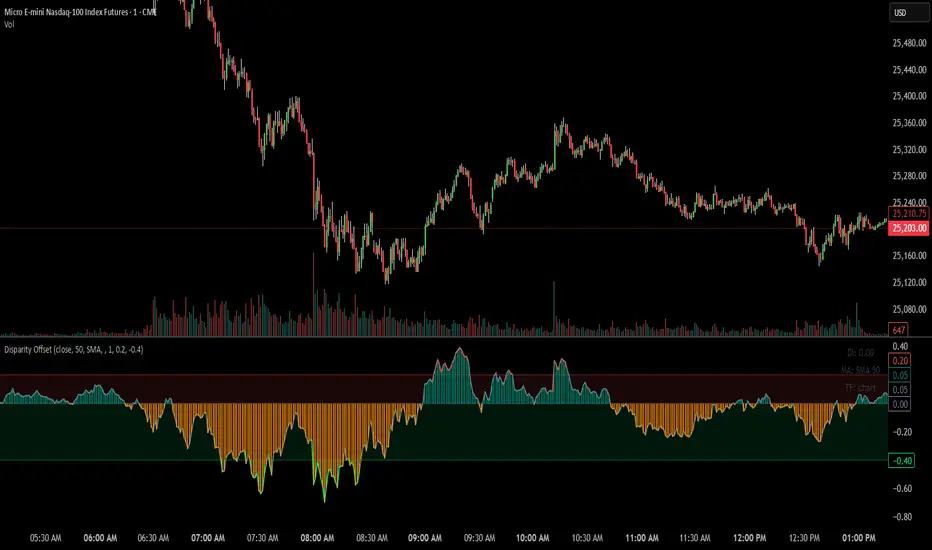
Disparity Offset measures how far price is offset from a selected moving average, expressed as a percentage. It shows whether price is trading above or below its average and by how much, helping visualize price extension, balance, and deviation from the mean. The indicator oscillates around a zero line, where zero represents price being aligned with the moving average.
How to Use Disparity Offset
Zero Line (0%)
When the Disparity Offset is near zero, price is close to the moving average, suggesting equilibrium.
Positive Values
Values above zero indicate price is above the moving average. Larger positive readings show stronger upward offset from the average.
Negative Values
Values below zero indicate price is below the moving average. Larger negative readings show stronger downward offset
Upper & Lower Offset Zones
The configurable upper and lower percentage levels highlight when price is relatively far from the moving average. Movement back toward the zero line can be used to study mean-reversion behavior.
Visual Aids
Histogram bars show direction and intensity of the offset
Shaded zones emphasize overextended conditions
Optional markers display crossings of offset levels and the zero line for observation and learning
"Disclaimer: This indicator is intended for educational purposes only and does not constitute financial advice. Trading involves significant risk, and users should perform their own research and consult with a licensed financial advisor before making any trading decisions.
Description
Disparity Offset measures how far price is offset from a selected moving average, expressed as a percentage. It shows whether price is trading above or below its average and by how much, helping visualize price extension, balance, and deviation from the mean. The indicator oscillates around a zero line, where zero represents price being aligned with the moving average.
How to Use Disparity Offset
Zero Line (0%)
When the Disparity Offset is near zero, price is close to the moving average, suggesting equilibrium.
Positive Values
Values above zero indicate price is above the moving average. Larger positive readings show stronger upward offset from the average.
Negative Values
Values below zero indicate price is below the moving average. Larger negative readings show stronger downward offset
Upper & Lower Offset Zones
The configurable upper and lower percentage levels highlight when price is relatively far from the moving average. Movement back toward the zero line can be used to study mean-reversion behavior.
Visual Aids
Histogram bars show direction and intensity of the offset
Shaded zones emphasize overextended conditions
Optional markers display crossings of offset levels and the zero line for observation and learning
"Disclaimer: This indicator is intended for educational purposes only and does not constitute financial advice. Trading involves significant risk, and users should perform their own research and consult with a licensed financial advisor before making any trading decisions.
Mã được bảo vệ
Tập lệnh này được đăng dưới dạng mã nguồn đóng. Tuy nhiên, bạn có thể sử dụng tự do và không giới hạn – tìm hiểu thêm tại đây.
Thông báo miễn trừ trách nhiệm
Thông tin và các ấn phẩm này không nhằm mục đích, và không cấu thành, lời khuyên hoặc khuyến nghị về tài chính, đầu tư, giao dịch hay các loại khác do TradingView cung cấp hoặc xác nhận. Đọc thêm tại Điều khoản Sử dụng.