INVITE-ONLY SCRIPT
LIZ ADX+DMI
Cập nhật
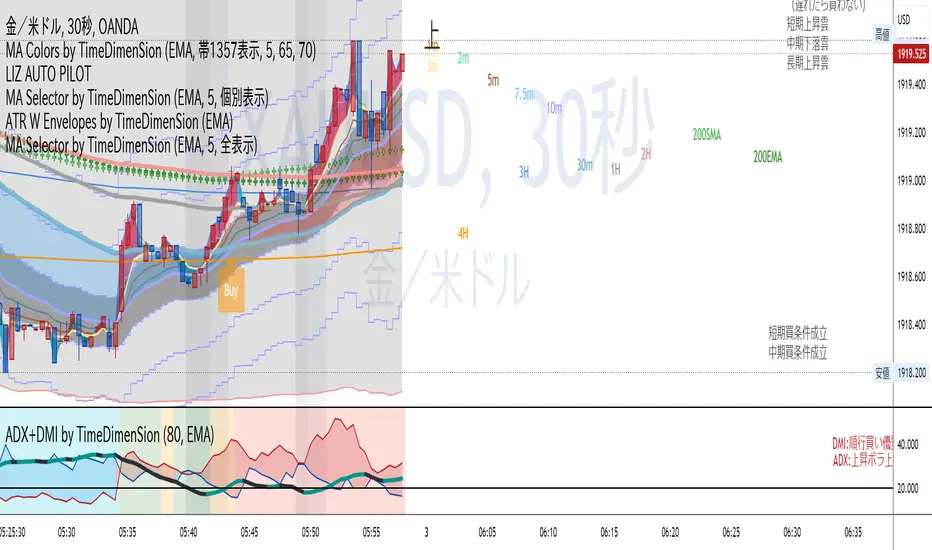
The thick lines represent ADX .
When the volatility increases, it faces up and the color changes from gray to green.
When the background is gray and starts to turn green from below the horizontal line of reference value of 20, the volatility increases, indicating that the environment is becoming easier to trade.
When ADX rises and then peaks out, the line goes down and the previously green line changes to gray.
This means that the trend that was going on before is now over.People who hold positions use them to sign off their hands.
Also, those who want to see the trend change and build a new position with a backstop can use it to sign their entries.
When the background is gray (due to the deterioration of ADX ), it indicates that the volatility is low, there is no value width, and the direction is unclear, so it's not a good time to trade.
The two thin lines, red and blue, are DMI.A red line at the top and a blue line at the bottom indicates that the buying power is dominant, and the gap between the two lines is painted red.
On the other hand, if the blue line is up and the red line is down, it shows that the selling power is superior and it is painted blue.
When the two ADX lines intersect, and the color between the lines is changing from red to blue or blue to red, it indicates that the buyer's advantage has changed.
You can look at when the line crosses, and then enter in the new direction of dominance and build a position.
You can also determine that your position is in line with the market flow if it is in line with your current predominance.
However, in the opposite case, it suggests that the position you have is not in the right direction.
When two DMI lines are crossed frequently, it indicates a range or random rate.
In such cases, the background is often gray, indicating that it is difficult to make a profit in trade.
If you are interested in the invitation-only indicator, please contact us on private chat.
太い線はADXを表してます。
ボラティリティーが上昇すると上を向き、色がグレーから緑に変化します。
背景がグレーの期間で、水平線で示す基準値20より低い位置から上を向き緑に変化し始める時、ボラティリティーが上昇し、トレードしやすい環境になりつつある事を示唆しています。
ADXが上昇し、やがてピークアウトするとラインが下を向き、それまで緑だったラインの色がグレーに変わります。これは、それまで続いていたトレンドが一旦終了した事を意味します。
ポジションを持っていた人は、手仕舞いのサインに使います。
また、トレンドの転換を確認し、逆張りで新規ポジションの構築を狙っている人はエントリーのサインに使えます。
ADXが低下しているせいで,背景がグレーになっている時は,ボラティリティーが低下しており、値幅がなく、方向性がはっきりしないという理由で取引に向いていない時期である事を示します。
赤、青2本の細いラインはDMIです。赤いラインが上、青いラインが下の時は買い勢力が優勢である事を示し、2本の線の間が赤に塗られます。
反対に青いラインが上、赤いラインが下の時は売り勢力が優勢である事を示し、青に塗られます。
2本のADXラインが交差し、線の間に塗られた色が、
赤から青、または青から赤に変化する時、買い方売り方の優劣が入れ替わった事を示唆します。
ラインがクロスするタイミングを見て、新しく優勢になった方向にエントリーし、ポジションを構築できます。
また、自分が既に持っているポジションが、現在優勢である方向と一致している時はマーケットの流れに合っていると判断できます。
しかし反対の時は、あなたが持っているポジションの方向が合っていない事を示唆しています。
2本のDMIラインが頻繁にクロスしている時は、レンジ相場やランダム相場である事を示唆します。
そのような時は背景もグレーになっている時が多く、トレードで利益を出すのが難しい環境である事を表しています。
招待専用インジに興味ある方はプライベートチャットに連絡をください。
Phát hành các Ghi chú
Added characters indicating trendy background colors.トレンドを示す背景の色を追加しました。
Phát hành các Ghi chú
Adjusted the background color for trending conditions.トレンドの状況を示す背景色を調節しました。
Phát hành các Ghi chú
Analysis content is now displayed in characters.分析内容が文字で表示されるようになりました。
Phát hành các Ghi chú
I changed the setting of the color of background. If ADX line turn up under 20level line, the color of background turn clear.背景の色の設定を変更しました。ADXが20レベルラインの下でも、上をむいたら(グレーだった)背景がクリアに変わります。
Phát hành các Ghi chú
The background color changes to gray when ADX is down and the volatility is down.The color has been improved to change in two stages.
ADXが低下し、ボラティリティーが下がっている時に背景色がグレーに変化します。
その色が2段階で変化するように改善しました。
Phát hành các Ghi chú
Corrected character information.We can now see whether the buying and selling advantages of ADX are in a positive or negative state against the trend.
文字情報を修正しました。
ADXによる買い優勢、売り優勢の状態が、トレンドに対し順行なのか逆行なのかがわかるようになりました。
Phát hành các Ghi chú
Can now be displayed on 15-second, 30-second, and monthly legs.The background color has been changed to make it easier to sense conversions.
15秒足、30秒足、月足に表示できるようになりました
背景色を変更し、転換を感じやすくしました
Phát hành các Ghi chú
The name of the indicator has been changed.インジケーターの名前を変更しました。
Phát hành các Ghi chú
The background color of the second legs has been corrected.The relationship between the three short-term moving averages displayed on the second leg is now correctly reflected.
秒足の背景色を修正しました。
秒足に表示される短期移動平均線3本の関係が正しく反映されるようになりました。
Phát hành các Ghi chú
Name Chnged.名前を変更しました。
Tập lệnh chỉ hiển thị cho người được mời
Quyền truy cập vào tập lệnh này bị hạn chế đối với người dùng được tác giả ủy quyền và thường yêu cầu thanh toán. Bạn có thể thêm nó vào mục yêu thích của mình, nhưng bạn sẽ chỉ có thể sử dụng nó sau khi yêu cầu sự cho phép từ tác giả. Liên hệ kowatasan để thêm thông tin, hoặc làm theo hướng dẫn của tác giả bên dưới.
TradingView gợi ý bạn không trả tiền để sử dụng tập lệnh trừ khi bạn tin tưởng 100% vào tác giả của tập lệnh và hiểu cách hoạt động của tập lệnh. Trong nhiều trường hợp, bạn có thể tìm thấy giải pháp thay thế nguồn mở tốt miễn phí trong Tập lệnh cộng đồng của chúng tôi.
Hướng dẫn của tác giả
″お申し込みサイトをご案内します。
https://liz-asset-design.com/
Bạn muốn sử dụng tập lệnh này trên biểu đồ?
Cảnh báo: vui lòng đọc trước khi yêu cầu quyền truy cập.
1人で悩まず、LINE公式登録
(インジ他無料プレゼント増量)
line.me/ti/p/@211ywenv
ユーチューバー対談
youtube.com/playlist?list=PL2sT2s7dIWWVYNuPLepsNNRRVCjQCqPUV
無料で学べるトレーダーズクラブ
liz-asset-design.com/
TicTokで時短動画配信中
tiktok.com/@akihikokowata
(インジ他無料プレゼント増量)
line.me/ti/p/@211ywenv
ユーチューバー対談
youtube.com/playlist?list=PL2sT2s7dIWWVYNuPLepsNNRRVCjQCqPUV
無料で学べるトレーダーズクラブ
liz-asset-design.com/
TicTokで時短動画配信中
tiktok.com/@akihikokowata
Thông báo miễn trừ trách nhiệm
Thông tin và ấn phẩm không có nghĩa là và không cấu thành, tài chính, đầu tư, kinh doanh, hoặc các loại lời khuyên hoặc khuyến nghị khác được cung cấp hoặc xác nhận bởi TradingView. Đọc thêm trong Điều khoản sử dụng.