OPEN-SOURCE SCRIPT
Cập nhật Daily RTH Moving Average On Intraday Timeframes [vnhilton]
This indicator is intended for intraday use from the daily timeframe down to the 1 minute. Outside this range, the indicator won't work as intended.
Higher timeframe moving averages are step-lines as they use values from higher timeframes to calculate the moving average. To have a smoother moving average from higher timeframes plotted on lower timeframes, this indicator uses the chart timeframe's candles, allowing for a smooth higher timeframe moving average. This indicator also includes Bollinger Bands. Note that the indicator only uses values from regular trading hours, as to not give weighting to values from extended trading hours.
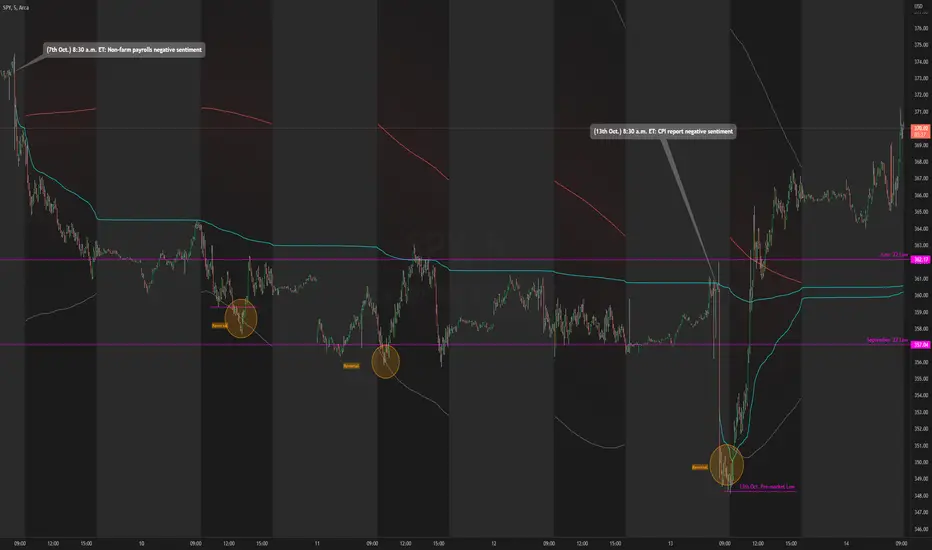
In the chart above, at October 7th, pre-market price action is bearish due to fundamentals around US employment data. This day led to an all-day-fader, stopping above the June low after attempting to break down the level again (previous breakdown attempts led to the September low). Note that the price is within the Bollinger bands of the 5 day moving average. We can see in the following days that SPY trended downwards, staying below the anchored VWAP when the October 7th news released, & pay attention to October 10th, where price attempts to make a new low-of-day but ends up outside the 5 day period ma, leading to a reversal. Look at October 13th, where pre-market price action again shows bearish sentiment, but due to fundamentals around CPI data. SPY opens below the September low, but also ends up outside the daily 5 period MA bands, meaning that the downside extension has extended too far, signalling for a reversion to the mean. This is why October 13th didn't lead to another all-day-fader, & instead trapped sellers trying to short the pre-market low, helping to fuel the relief rally to cause the upsides the June & September lows, & the anchored VWAPs from both significant pre-market events, to be reclaimed, where price pauses at the confluence of the 5 day moving average & the June low.
Higher timeframe moving averages are step-lines as they use values from higher timeframes to calculate the moving average. To have a smoother moving average from higher timeframes plotted on lower timeframes, this indicator uses the chart timeframe's candles, allowing for a smooth higher timeframe moving average. This indicator also includes Bollinger Bands. Note that the indicator only uses values from regular trading hours, as to not give weighting to values from extended trading hours.
In the chart above, at October 7th, pre-market price action is bearish due to fundamentals around US employment data. This day led to an all-day-fader, stopping above the June low after attempting to break down the level again (previous breakdown attempts led to the September low). Note that the price is within the Bollinger bands of the 5 day moving average. We can see in the following days that
Phát hành các Ghi chú
Fixed bollinger band calculationsMã nguồn mở
Theo đúng tinh thần TradingView, tác giả của tập lệnh này đã công bố nó dưới dạng mã nguồn mở, để các nhà giao dịch có thể xem xét và xác minh chức năng. Chúc mừng tác giả! Mặc dù bạn có thể sử dụng miễn phí, hãy nhớ rằng việc công bố lại mã phải tuân theo Nội quy.
Thông báo miễn trừ trách nhiệm
Thông tin và các ấn phẩm này không nhằm mục đích, và không cấu thành, lời khuyên hoặc khuyến nghị về tài chính, đầu tư, giao dịch hay các loại khác do TradingView cung cấp hoặc xác nhận. Đọc thêm tại Điều khoản Sử dụng.
Mã nguồn mở
Theo đúng tinh thần TradingView, tác giả của tập lệnh này đã công bố nó dưới dạng mã nguồn mở, để các nhà giao dịch có thể xem xét và xác minh chức năng. Chúc mừng tác giả! Mặc dù bạn có thể sử dụng miễn phí, hãy nhớ rằng việc công bố lại mã phải tuân theo Nội quy.
Thông báo miễn trừ trách nhiệm
Thông tin và các ấn phẩm này không nhằm mục đích, và không cấu thành, lời khuyên hoặc khuyến nghị về tài chính, đầu tư, giao dịch hay các loại khác do TradingView cung cấp hoặc xác nhận. Đọc thêm tại Điều khoản Sử dụng.