PROTECTED SOURCE SCRIPT
PpSigan ZigZag++
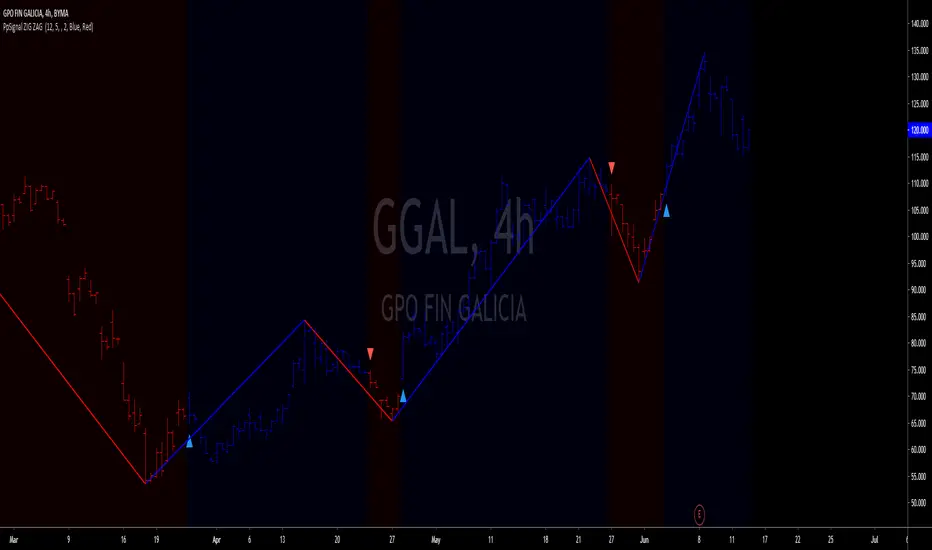
The Zig Zag indicator plots points on the chart whenever prices reverse by a percentage greater than a pre-chosen variable. Straight lines are then drawn, connecting these points. The indicator is used to help identify price trends. It eliminates random price fluctuations and attempts to show trend changes. Zig Zag lines only appear when there is a price movement between a swing high and a swing low that is greater than a specified percentage; often 5%. By filtering minor price movements, the indicator makes trends easier to spot in all time frames.
Buy when the price is blue or green choose your favorite up color and arrow is up.
sell when the price is red or orange choose your favorite up color and arrow is up.
Buy when the price is blue or green choose your favorite up color and arrow is up.
sell when the price is red or orange choose your favorite up color and arrow is up.
Mã được bảo vệ
Tập lệnh này được đăng dưới dạng mã nguồn đóng. Tuy nhiên, bạn có thể sử dụng tự do và không giới hạn – tìm hiểu thêm tại đây.
Thông báo miễn trừ trách nhiệm
Thông tin và các ấn phẩm này không nhằm mục đích, và không cấu thành, lời khuyên hoặc khuyến nghị về tài chính, đầu tư, giao dịch hay các loại khác do TradingView cung cấp hoặc xác nhận. Đọc thêm tại Điều khoản Sử dụng.