PROTECTED SOURCE SCRIPT
Zscore correlation volatility Demi vie Ilker
This is an all-in-one "regime" dashboard for pairs trading. It's designed to stop you from taking bad mean-reversion trades by first identifying if the market conditions are stable.
It answers two key questions:
1. "Is this a good time to trade a mean-reversion strategy?" (The Regime Filter)
2. "If yes, how fast should I expect the trade to work?" (The Half-Life)
## 📈 Key Features
This script runs four main calculations at once:
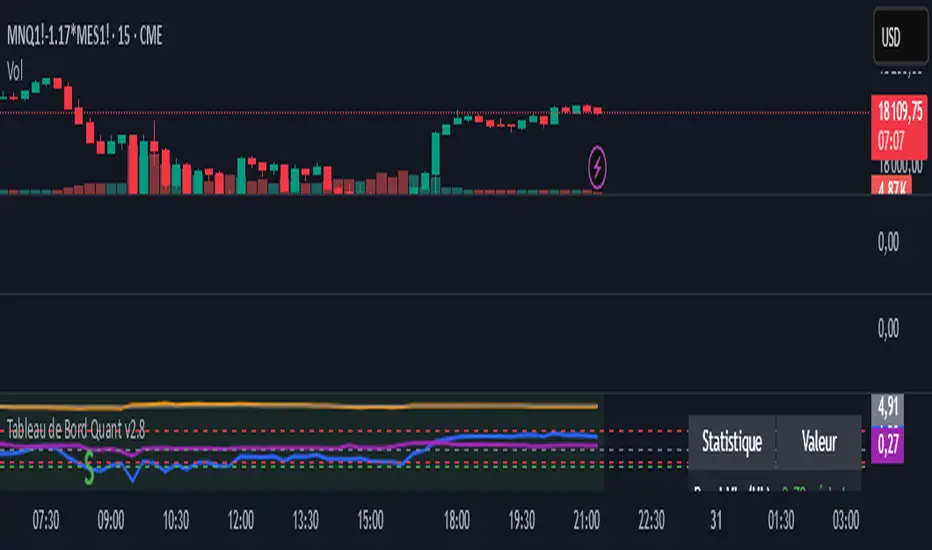
1. The Price Z-Score (Blue Line)
This is your primary entry signal. It shows you how "cheap" (e.g., -2.0) or "expensive" (e.g., +2.0) the spread is relative to its short-term history (z_len).
2. The Regime Background (Green / Red)
This is the most important part. It acts as a "traffic light" for your trading:
• 🟢 GREEN (Stable Regime): It's safe to look for mean-reversion trades. This means both the correlation and volatility filters are stable.
• 🔴 RED (Unstable Regime): DO NOT trade mean-reversion. The relationship between the assets is broken. Any signal is likely a trap.
3. The Regime Filters (Your "Guards")
These two filters determine the background color:
• Correlation Z-Score (Purple Line): It measures the stability of the correlation. If this purple line drops below the red threshold (corr_z_threshold), it means the correlation has broken down, and the background turns RED.
• Volatility Ratio (Orange Line): It compares the volatility of the two assets. If one asset suddenly becomes much more volatile than the other (deviating from its average ratio), the background turns RED.
4. The Half-Life Dashboard (Top-Right Table)
This is your "speedometer." Based on an Ornstein-Uhlenbeck model, it calculates the average time (in bars) it takes for the spread to revert 50% of the way back to its mean.
• HL: 13.86 periods: You can expect it to take ~14 bars to go from a Z-Score of 2.0 to 1.0.
• N/A (Divergent): A critical warning. The math shows the spread is currently diverging and has no tendency to revert.
## 💡 How to Use This Indicator
Setup (Required):
1. Load a spread chart (e.g., type MES/MNQ or MGC/SIL into the TradingView search).
2. Add this indicator to the spread chart.
3. Go into the indicator's Settings (⚙).
4. In the "Inputs" tab, you must enter the two individual tickers:
• Symbol 1 Ticker: MGC
• Symbol 2 Ticker: SIL
(This is so the script can calculate the Correlation and Volatility filters).
Trading Signals
1. Mean-Reversion Signals
• BUY Signal (Green Triangle ▲): Appears only if the background is GREEN and the Price Z-Score (blue line) crosses below the -2.0 band.
• SELL Signal (Red Triangle ▼): Appears only if the background is GREEN and the Price Z-Score (blue line) crosses above the +2.0 band.
• EXIT: Your target is a reversion back to the 0 line. The Half-Life value gives you an idea of how long to wait.
2. Divergence Warning Signals
• Blue/Fuchsia Triangles (▲ / ▼): These appear at the exact moment the background turns RED. They warn you that the "stable" regime is broken and a new "divergence" or "trend" regime may be starting. This is a signal to stay out or manage any existing positions.
This tool is designed to add a layer of quantitative, risk-management logic to a standard Z-Score strategy. It helps you trade only when the statistics are in your favor.
It answers two key questions:
1. "Is this a good time to trade a mean-reversion strategy?" (The Regime Filter)
2. "If yes, how fast should I expect the trade to work?" (The Half-Life)
## 📈 Key Features
This script runs four main calculations at once:
1. The Price Z-Score (Blue Line)
This is your primary entry signal. It shows you how "cheap" (e.g., -2.0) or "expensive" (e.g., +2.0) the spread is relative to its short-term history (z_len).
2. The Regime Background (Green / Red)
This is the most important part. It acts as a "traffic light" for your trading:
• 🟢 GREEN (Stable Regime): It's safe to look for mean-reversion trades. This means both the correlation and volatility filters are stable.
• 🔴 RED (Unstable Regime): DO NOT trade mean-reversion. The relationship between the assets is broken. Any signal is likely a trap.
3. The Regime Filters (Your "Guards")
These two filters determine the background color:
• Correlation Z-Score (Purple Line): It measures the stability of the correlation. If this purple line drops below the red threshold (corr_z_threshold), it means the correlation has broken down, and the background turns RED.
• Volatility Ratio (Orange Line): It compares the volatility of the two assets. If one asset suddenly becomes much more volatile than the other (deviating from its average ratio), the background turns RED.
4. The Half-Life Dashboard (Top-Right Table)
This is your "speedometer." Based on an Ornstein-Uhlenbeck model, it calculates the average time (in bars) it takes for the spread to revert 50% of the way back to its mean.
• HL: 13.86 periods: You can expect it to take ~14 bars to go from a Z-Score of 2.0 to 1.0.
• N/A (Divergent): A critical warning. The math shows the spread is currently diverging and has no tendency to revert.
## 💡 How to Use This Indicator
Setup (Required):
1. Load a spread chart (e.g., type MES/MNQ or MGC/SIL into the TradingView search).
2. Add this indicator to the spread chart.
3. Go into the indicator's Settings (⚙).
4. In the "Inputs" tab, you must enter the two individual tickers:
• Symbol 1 Ticker: MGC
• Symbol 2 Ticker: SIL
(This is so the script can calculate the Correlation and Volatility filters).
Trading Signals
1. Mean-Reversion Signals
• BUY Signal (Green Triangle ▲): Appears only if the background is GREEN and the Price Z-Score (blue line) crosses below the -2.0 band.
• SELL Signal (Red Triangle ▼): Appears only if the background is GREEN and the Price Z-Score (blue line) crosses above the +2.0 band.
• EXIT: Your target is a reversion back to the 0 line. The Half-Life value gives you an idea of how long to wait.
2. Divergence Warning Signals
• Blue/Fuchsia Triangles (▲ / ▼): These appear at the exact moment the background turns RED. They warn you that the "stable" regime is broken and a new "divergence" or "trend" regime may be starting. This is a signal to stay out or manage any existing positions.
This tool is designed to add a layer of quantitative, risk-management logic to a standard Z-Score strategy. It helps you trade only when the statistics are in your favor.
Mã được bảo vệ
Tập lệnh này được đăng dưới dạng mã nguồn đóng. Tuy nhiên, bạn có thể sử dụng tự do và không giới hạn – tìm hiểu thêm tại đây.
Thông báo miễn trừ trách nhiệm
Thông tin và các ấn phẩm này không nhằm mục đích, và không cấu thành, lời khuyên hoặc khuyến nghị về tài chính, đầu tư, giao dịch hay các loại khác do TradingView cung cấp hoặc xác nhận. Đọc thêm tại Điều khoản Sử dụng.