PROTECTED SOURCE SCRIPT
Cập nhật Mykung's Financial Table (Revenue, EPS, Net margin)
A compact fundamentals dashboard that displays the last **8 fiscal quarters** for the current symbol. It’s designed for clarity (minimal decimals) and flexible presentation, with a dynamic column layout and accurate quarter labels.
## What it shows
**Columns (left → right):**
`Quarter | Revenue | YoY % | QoQ % | EPS | YoY % | QoQ % | [Net Margin | YoY % | QoQ %]`
* **Quarter** — formatted as `YYYY Q#` (e.g., `2025 Q2`).
Labels are derived from **fiscal period end dates** for accuracy.
* **Revenue** — compact notation (K/M/B/T), **no decimals**.
* **EPS** — uses **Diluted EPS** by default and falls back to **Basic EPS** if Diluted is unavailable. Displayed with **2 decimals**.
* **Net Margin** — displayed with **1 decimal**.
*Note:* Its YoY/QoQ columns represent **percentage-point** changes (absolute differences), not relative percent changes.
* **YoY % and QoQ %** — shown as **integers** (no decimals). Positive values are colored green; negative values red.
## Key features
* **Accurate quarter labels** from fundamentals (`FISCAL_PERIOD_END_DATE` → fallback `FINANCIAL_END_TIME`).
* **Dynamic layout:**
* Show all 10 columns (include Net Margin group), or
* Hide Net Margin to render a **7-column** table automatically.
* **Row order:** **Oldest at top → Latest at bottom** (chronological reading).
* **Customization:**
* Table position (nine presets: corners/centers).
* Text size.
* Table background color.
* **Header colors** (text & background) — also applied to the **Quarter** column cells for visual grouping.
* **Body text color** for data cells.
## Inputs (Settings)
* **Table Position** — place the table anywhere on the chart.
* **Text Size** — auto/tiny/small/normal/large/huge.
* **Table Background** — overall table BG color.
* **Header Background Color** — header & Quarter column background.
* **Header Text Color** — header & Quarter column text color.
* **Body Text Color** — data cells text color.
* **Show Net Margin Group (Cols 7–9)** — toggle between 10-col or 7-col layout.
## Calculations
* **QoQ %** = $(Current − Previous) / |Previous|$ × 100
* **YoY %** = $(Current − 4Q Ago) / |4Q Ago|$ × 100
* **Net Margin YoY / QoQ** = **difference in percentage points** (e.g., 12.4% → 10.9% = −1.5pp)
## Notes & limitations
* Requires symbols with **quarterly fundamentals** on TradingView. If a field is unavailable, it shows **N/A**.
* Fundamentals are updated by TradingView; values may refresh after earnings filings.
* Works on any chart timeframe; data comes from **fundamentals**, not price bars.
* Colors are indicative only and not investment advice.
**Built for readability**: minimal decimals (EPS 2dp, Net Margin 1dp), integer percentages, and compact revenue formatting—so you can scan eight quarters at a glance.
Phát hành các Ghi chú
Change from percentage-point (pp) to % (relative change) for Net margin YoY% and QoQ%Phát hành các Ghi chú
fixed many bugsPhát hành các Ghi chú
fixed some valuesPhát hành các Ghi chú
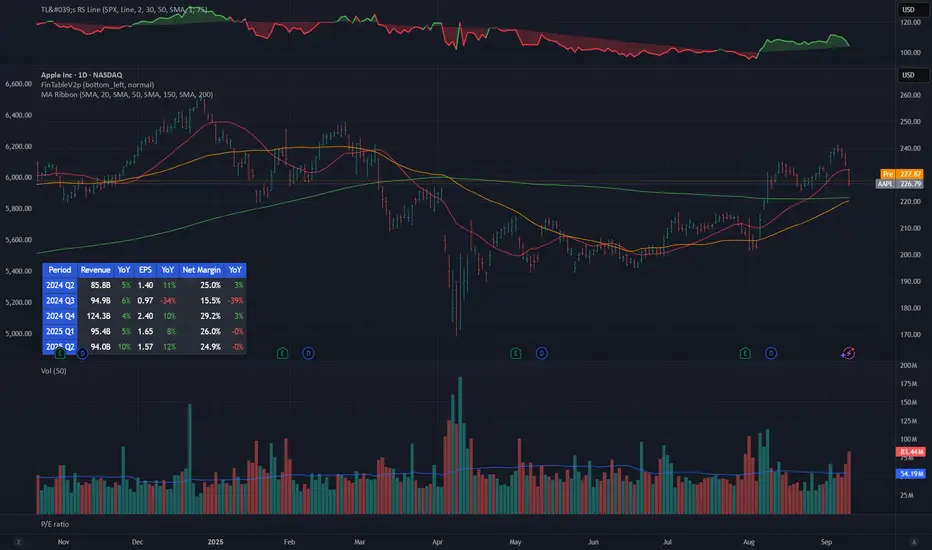
A simplified and lightweight financial table designed for quick stock analysis.- Shows 5 most recent reporting periods with Revenue, EPS, and optional Net Margin
- Displays only YoY (%) growth (no QoQ for cleaner view)
- Column headers are simplified (“Period”, “YoY”)
- Flexible table layout: choose 7 or 10 columns depending on Net Margin visibility
- Minimalist number formatting for a clear, modern look
- Missing data points are displayed as “-”
- Fully customizable header colors, background, and text colors
This public version is lighter and faster, making it ideal for traders and analysts who want essential quarterly metrics at a glance.
Phát hành các Ghi chú
Fixed the digit of revenuePhát hành các Ghi chú
Fixed some bugsMã được bảo vệ
Tập lệnh này được đăng dưới dạng mã nguồn đóng. Tuy nhiên, bạn có thể sử dụng tự do và không giới hạn – tìm hiểu thêm tại đây.
Thông báo miễn trừ trách nhiệm
Thông tin và các ấn phẩm này không nhằm mục đích, và không cấu thành, lời khuyên hoặc khuyến nghị về tài chính, đầu tư, giao dịch hay các loại khác do TradingView cung cấp hoặc xác nhận. Đọc thêm tại Điều khoản Sử dụng.
Mã được bảo vệ
Tập lệnh này được đăng dưới dạng mã nguồn đóng. Tuy nhiên, bạn có thể sử dụng tự do và không giới hạn – tìm hiểu thêm tại đây.
Thông báo miễn trừ trách nhiệm
Thông tin và các ấn phẩm này không nhằm mục đích, và không cấu thành, lời khuyên hoặc khuyến nghị về tài chính, đầu tư, giao dịch hay các loại khác do TradingView cung cấp hoặc xác nhận. Đọc thêm tại Điều khoản Sử dụng.