OPEN-SOURCE SCRIPT
Cập nhật Price × Volume Table
It creates a table showing:
1- Daily Close × Daily Volume
2- Current Close × Current Volume
3- Close × Highest Volume (last 360 candles)
1- Daily Close × Daily Volume
2- Current Close × Current Volume
3- Close × Highest Volume (last 360 candles)
Phát hành các Ghi chú
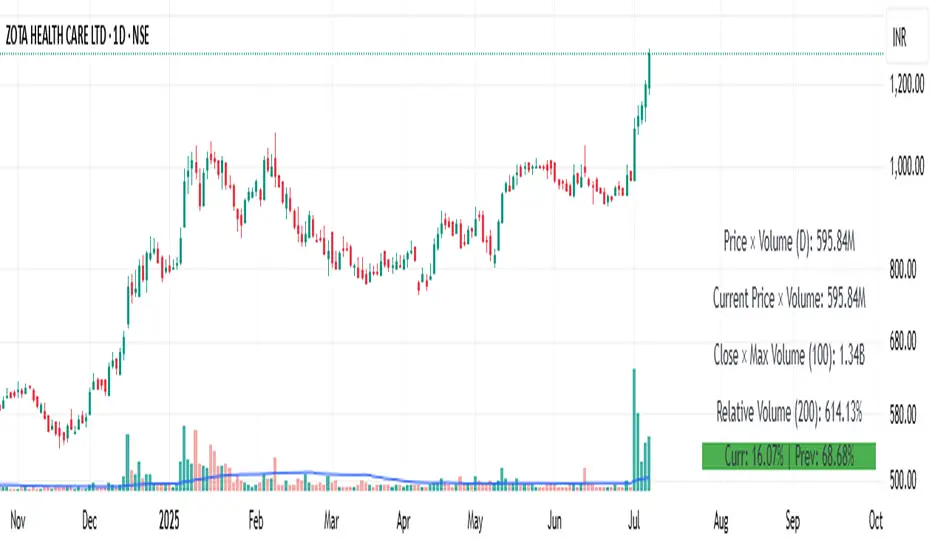
This indicator displays a real-time table showing important volume and liquidity metrics to help traders assess market activity at a glance.Included Metrics:
Price × Volume (1D): Daily closing price × volume from the selected higher timeframe (default: 1D).
Current Price × Volume: Live price × volume for the current bar.
Close × Max Volume (Lookback): Current close multiplied by the highest volume observed over a user-defined lookback period (default: 360 candles).
Relative Volume (RVOL %): Compares current volume with its moving average (default MA: 200) and shows the result as a percentage.
User Settings:
Toggle any of the 4 rows on/off
Customize the moving average length for RVOL
Choose the lookback period for highest volume
Select the timeframe for daily data
Use Case:
This tool helps traders:
Spot volume anomalies
Gauge institutional interest via RVOL
Identify high-liquidity conditions for entries/exits
Notes:
Table is positioned in the bottom-right corner
All values are auto-formatted (e.g., 1.5M, 3.2B)
Compatible with all instruments and timeframes
Phát hành các Ghi chú
Feature Added:- 1- Current candle volume change
2- Previous candle Volume change
Mã nguồn mở
Theo đúng tinh thần TradingView, tác giả của tập lệnh này đã công bố nó dưới dạng mã nguồn mở, để các nhà giao dịch có thể xem xét và xác minh chức năng. Chúc mừng tác giả! Mặc dù bạn có thể sử dụng miễn phí, hãy nhớ rằng việc công bố lại mã phải tuân theo Nội quy.
Thông báo miễn trừ trách nhiệm
Thông tin và các ấn phẩm này không nhằm mục đích, và không cấu thành, lời khuyên hoặc khuyến nghị về tài chính, đầu tư, giao dịch hay các loại khác do TradingView cung cấp hoặc xác nhận. Đọc thêm tại Điều khoản Sử dụng.