PROTECTED SOURCE SCRIPT
ICT ADR/AWR/AMR Levels | Trade Symmetry
🌟 ICT ADR/AWR/AMR Levels
📋 Overview
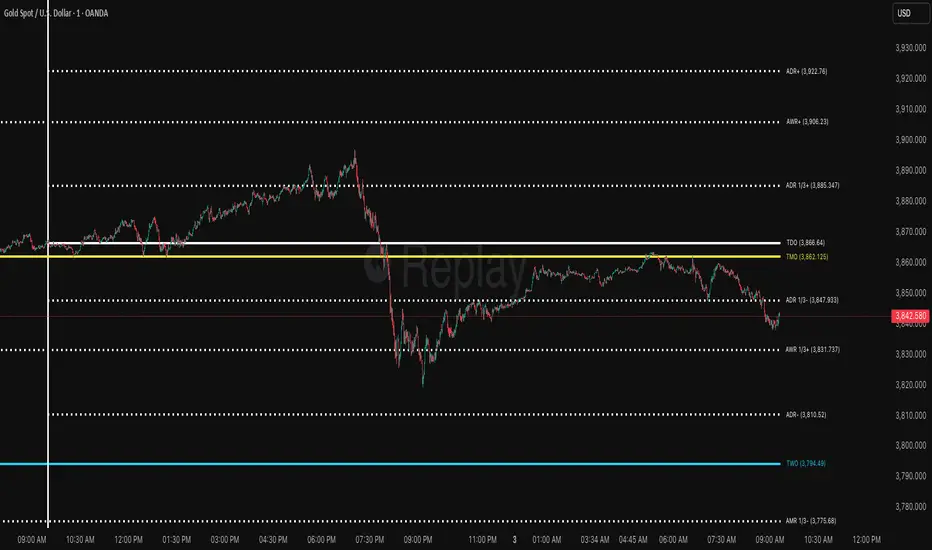
This advanced technical analysis tool calculates and displays Average Daily Range (ADR), Average Weekly Range (AWR), and Average Monthly Range (AMR) levels. The indicator incorporates smart detection technology that automatically maintains monthly level visibility when historical data becomes unavailable.
✨ Key Features
🕒 Precise Time Alignment
True Daily Opens (TDO) aligned with 00:00 UTC
True Weekly Opens (TWO) at 00:00 UTC (configurable Monday/Sunday start)
True Monthly Opens (TMO) at 00:00 UTC on month start
Customizable period start times and parameters
📊 Comprehensive Multi-Timeframe Analysis
Daily Levels (ADR): Base level with multiple extensions including Fibonacci ratios
Weekly Levels (AWR): Weekly range projections and key levels
Monthly Levels (AMR): Monthly range calculations with automatic fallback system
🔄 Intelligent Level Management
Smart Detection: Automatically switches between historical and current monthly levels
Continuous Visibility: Ensures reference levels remain visible regardless of data availability
Seamless Operation: No manual adjustment needed for level transitions
⚙️ Extensive Customization
Adjustable lookback periods for all timeframes
Independent control over each level type and extension
Complete visual customization (colors, styles, widths)
Flexible labeling and display options
Configurable vertical separation lines
🏷️ Advanced Display Options
Clean, organized label placement
Optional price display in labels
Historical period tracking
Overlapping label merging capability
Adjustable label sizing and positioning
🚀 How to Use
Initial Setup: Enable desired timeframes (Daily/Weekly/Monthly)
Range Configuration: Set appropriate averaging periods for each timeframe
Level Selection: Choose which extension levels to display
Visual Settings: Customize colors and styles to match your trading workspace
Automatic Operation: The indicator intelligently manages level transitions
💡 Practical Applications
Identify potential support and resistance areas across multiple timeframes
Establish realistic profit targets based on historical volatility
Plan trade entries and exits around significant time-based levels
Analyze market volatility patterns across different time horizons
Incorporate institutional trading concepts into your analysis
📋 Overview
This advanced technical analysis tool calculates and displays Average Daily Range (ADR), Average Weekly Range (AWR), and Average Monthly Range (AMR) levels. The indicator incorporates smart detection technology that automatically maintains monthly level visibility when historical data becomes unavailable.
✨ Key Features
🕒 Precise Time Alignment
True Daily Opens (TDO) aligned with 00:00 UTC
True Weekly Opens (TWO) at 00:00 UTC (configurable Monday/Sunday start)
True Monthly Opens (TMO) at 00:00 UTC on month start
Customizable period start times and parameters
📊 Comprehensive Multi-Timeframe Analysis
Daily Levels (ADR): Base level with multiple extensions including Fibonacci ratios
Weekly Levels (AWR): Weekly range projections and key levels
Monthly Levels (AMR): Monthly range calculations with automatic fallback system
🔄 Intelligent Level Management
Smart Detection: Automatically switches between historical and current monthly levels
Continuous Visibility: Ensures reference levels remain visible regardless of data availability
Seamless Operation: No manual adjustment needed for level transitions
⚙️ Extensive Customization
Adjustable lookback periods for all timeframes
Independent control over each level type and extension
Complete visual customization (colors, styles, widths)
Flexible labeling and display options
Configurable vertical separation lines
🏷️ Advanced Display Options
Clean, organized label placement
Optional price display in labels
Historical period tracking
Overlapping label merging capability
Adjustable label sizing and positioning
🚀 How to Use
Initial Setup: Enable desired timeframes (Daily/Weekly/Monthly)
Range Configuration: Set appropriate averaging periods for each timeframe
Level Selection: Choose which extension levels to display
Visual Settings: Customize colors and styles to match your trading workspace
Automatic Operation: The indicator intelligently manages level transitions
💡 Practical Applications
Identify potential support and resistance areas across multiple timeframes
Establish realistic profit targets based on historical volatility
Plan trade entries and exits around significant time-based levels
Analyze market volatility patterns across different time horizons
Incorporate institutional trading concepts into your analysis
Mã được bảo vệ
Tập lệnh này được đăng dưới dạng mã nguồn đóng. Tuy nhiên, bạn có thể sử dụng tự do và không giới hạn – tìm hiểu thêm tại đây.
Thông báo miễn trừ trách nhiệm
Thông tin và các ấn phẩm này không nhằm mục đích, và không cấu thành, lời khuyên hoặc khuyến nghị về tài chính, đầu tư, giao dịch hay các loại khác do TradingView cung cấp hoặc xác nhận. Đọc thêm tại Điều khoản Sử dụng.