OPEN-SOURCE SCRIPT
Cập nhật Purple Cloud
The above lines calculate several intermediate values used in the indicator's calculations. Here's a breakdown of each variable:
a1: Represents a modified Exponential Moving Average (EMA) of the high price series, subtracted by a Simple Moving Average (SMA) of the low price series.
a2: Takes the square root of the lowest value between the highest close price over the last 200 bars and the current close price, multiplied by a1.
b1: Represents a modified EMA of the low price series, subtracted by an SMA of the high price series.
b2: Takes the square root of the highest value between the lowest close price over the last 200 bars and the current close price, multiplied by b1.
c1: Represents the square root of a2 multiplied by b2.
These lines create multiple plots using the plot function. Each plot represents a displaced version of c1 by a certain multiple of the Average True Range (ATR) multiplied by a constant factor (0.1, 0.2, 0.3, etc.). The transparency (transp) is set to 100 for all plots.
Phát hành các Ghi chú
Add Alpha Phát hành các Ghi chú
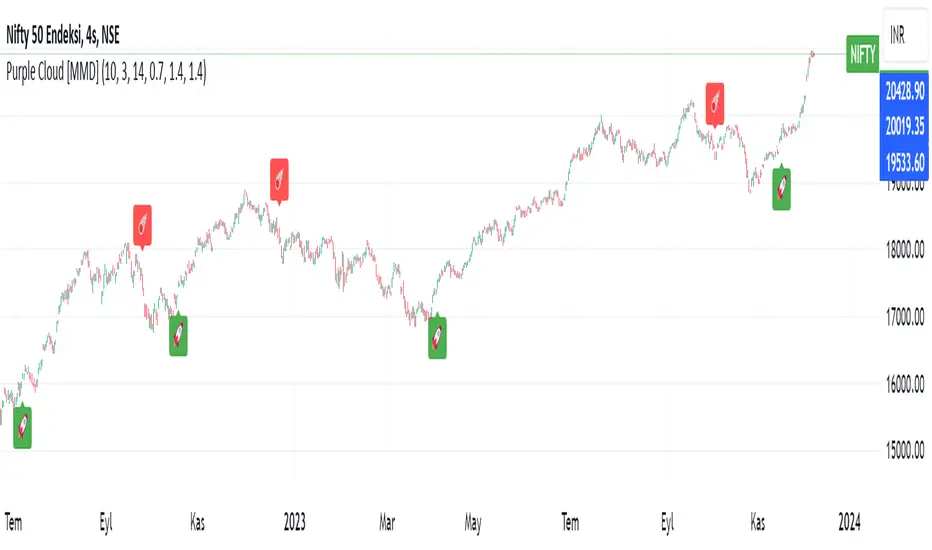
Added Pink Green Yellow bar.Green Bar--->Buy
Pink Bar--->Sell
Yellow Bar--->Unstable
Phát hành các Ghi chú
I added Maybe Pump Maybe DumpPhát hành các Ghi chú
Added Rsi Background ColorPhát hành các Ghi chú
Deleted CloudsPhát hành các Ghi chú
Added Bomb Pump DumpPhát hành các Ghi chú
Changed AllPhát hành các Ghi chú
Change NamePhát hành các Ghi chú
added alert and funcsPhát hành các Ghi chú
Added colourPhát hành các Ghi chú
Added MMD BandsPhát hành các Ghi chú
Added Supertrend and Ema 200 50 20Phát hành các Ghi chú
Added Buying Pressure Threshold % and Selling Pressure Threshold % and changed formulaMã nguồn mở
Theo đúng tinh thần TradingView, tác giả của tập lệnh này đã công bố nó dưới dạng mã nguồn mở, để các nhà giao dịch có thể xem xét và xác minh chức năng. Chúc mừng tác giả! Mặc dù bạn có thể sử dụng miễn phí, hãy nhớ rằng việc công bố lại mã phải tuân theo Nội quy.
Thông báo miễn trừ trách nhiệm
Thông tin và các ấn phẩm này không nhằm mục đích, và không cấu thành, lời khuyên hoặc khuyến nghị về tài chính, đầu tư, giao dịch hay các loại khác do TradingView cung cấp hoặc xác nhận. Đọc thêm tại Điều khoản Sử dụng.
Mã nguồn mở
Theo đúng tinh thần TradingView, tác giả của tập lệnh này đã công bố nó dưới dạng mã nguồn mở, để các nhà giao dịch có thể xem xét và xác minh chức năng. Chúc mừng tác giả! Mặc dù bạn có thể sử dụng miễn phí, hãy nhớ rằng việc công bố lại mã phải tuân theo Nội quy.
Thông báo miễn trừ trách nhiệm
Thông tin và các ấn phẩm này không nhằm mục đích, và không cấu thành, lời khuyên hoặc khuyến nghị về tài chính, đầu tư, giao dịch hay các loại khác do TradingView cung cấp hoặc xác nhận. Đọc thêm tại Điều khoản Sử dụng.