OPEN-SOURCE SCRIPT
Volume 2x Average
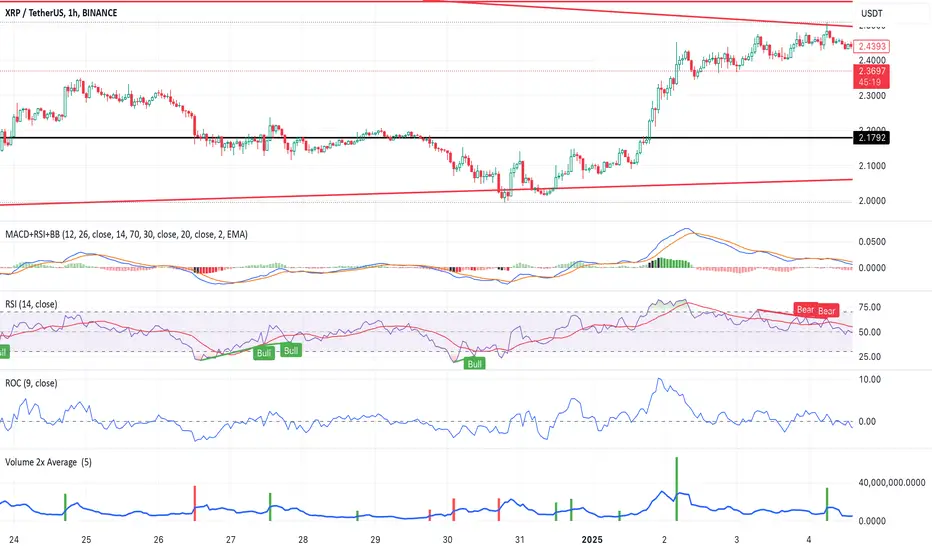
This script helps traders identify stocks or instruments experiencing unusually high trading volume compared to their average volume over a user-defined period. The key features include:
1. Volume 2x Average Filter:
Highlights bars where the current volume is greater than twice the average volume for the selected period.
2. Dynamic Average Period:
Allows users to specify the period for calculating the average volume (e.g., 1 day, 5 days, etc.).
3. Color-Coded Bars:
• Green Bars: Indicate bullish candlesticks where the closing price is higher than the
opening price.
• Red Bars: Indicate bearish candlesticks where the closing price is lower than the
opening price.
4. Optional Bar Visibility:
Users can toggle the visibility of the highlighted volume bars, providing flexibility for clean chart analysis.
5. Average Volume Line:
Plots the average volume as a blue line for reference.
Use Case:
This script is ideal for traders looking to identify potential breakouts, reversals, or key market movements driven by significant volume spikes. By dynamically adjusting the average period and toggling bar visibility, users can tailor the script to fit various trading strategies and timeframes.
Inputs:
1. Show 2x Volume Bars:
• Toggle to enable or disable the display of the highlighted volume bars.
2. Average Volume Period:
• Specify the number of periods (e.g., 1 for 1 day, 5 for 5 days) to calculate the average
volume.
Disclaimer:
This script is for educational purposes only and does not constitute financial advice. Use it alongside your analysis and trading strategy.
Mã nguồn mở
Theo đúng tinh thần TradingView, tác giả của tập lệnh này đã công bố nó dưới dạng mã nguồn mở, để các nhà giao dịch có thể xem xét và xác minh chức năng. Chúc mừng tác giả! Mặc dù bạn có thể sử dụng miễn phí, hãy nhớ rằng việc công bố lại mã phải tuân theo Nội quy.
Thông báo miễn trừ trách nhiệm
Thông tin và các ấn phẩm này không nhằm mục đích, và không cấu thành, lời khuyên hoặc khuyến nghị về tài chính, đầu tư, giao dịch hay các loại khác do TradingView cung cấp hoặc xác nhận. Đọc thêm tại Điều khoản Sử dụng.