OPEN-SOURCE SCRIPT
Red Pill VWAP/RSI Divergence
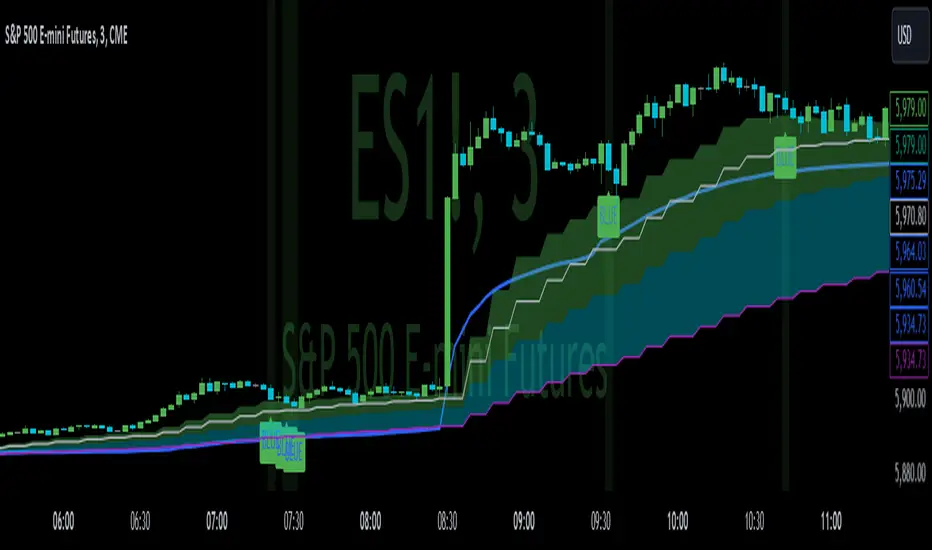
I created this indicator to identify moments in time VWAP and RSI are diverging.
Ideally useful in strong trend, bullish or bearish, as a potential entry point on a pull back for continuation. Not to be used as a stand alone signal, but rather in conjunction with any possible trend/momentum strategy.
VWAP is identified as the blue line. Green label(blue pill) is your potential entry on a pull back when price is above, stacked EMAS & VWAP for a long position. Red label(red pill) is your potential entry on a pull back when price is below inversely stacked EMAS & VWAP for a short position. These are the 2 ideal scenarios I have found. Please back test for yourself
I have had great results but must emphasis this is not a stand alone buy/sell. I use it in confluence to add conviction to my current A+ setups.
***Pivot ribbon in chart created by Saty Mahajan set to 3/10 time warp works ideal in conjunction.
***please note false positive and false negative signals can occur, particularly in chop
I hope you find this helpful . TRADE SAFE!
Mã nguồn mở
Theo đúng tinh thần TradingView, tác giả của tập lệnh này đã công bố nó dưới dạng mã nguồn mở, để các nhà giao dịch có thể xem xét và xác minh chức năng. Chúc mừng tác giả! Mặc dù bạn có thể sử dụng miễn phí, hãy nhớ rằng việc công bố lại mã phải tuân theo Nội quy.
Thông báo miễn trừ trách nhiệm
Thông tin và các ấn phẩm này không nhằm mục đích, và không cấu thành, lời khuyên hoặc khuyến nghị về tài chính, đầu tư, giao dịch hay các loại khác do TradingView cung cấp hoặc xác nhận. Đọc thêm tại Điều khoản Sử dụng.