OPEN-SOURCE SCRIPT
Cập nhật DTB

Dynamic Trendline Bands with Buy/Sell Pressure Detection
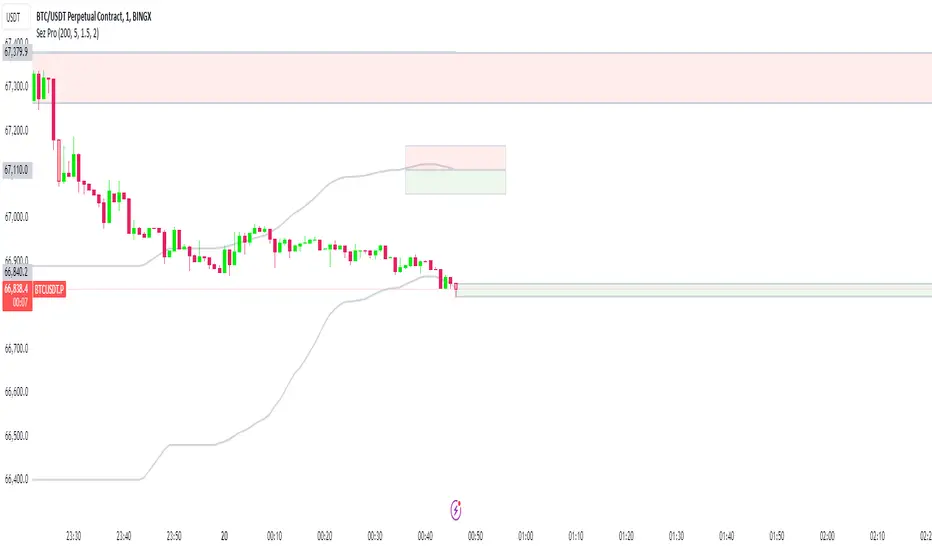
This indicator provides a comprehensive analysis of price movements by incorporating smoothed high and low bands, a midline, and the detection of buying and selling pressure. It is designed to help traders identify key support and resistance levels as well as potential buy and sell signals.
**Features:**
- **Smooth High and Low Bands:** Based on the highest high and lowest low over a specified period, smoothed using a simple moving average (SMA) to reduce noise and enhance clarity.
- **Midline:** The average of the smoothed high and low bands, providing a central reference point for price movements.
- **Buying and Selling Pressure Detection:** Highlights candles with significant buying or selling pressure, indicated by light green for buying pressure and light red for selling pressure. This is determined based on volume thresholds and price movement.
- **Trendlines:** Dynamic trendlines are drawn based on recent highs and lows, helping to visualize the current trend direction.
**How to Use:**
1. **High-Low Bands:** Use these bands to identify key support and resistance levels.
2. **Midline:** Monitor the midline for potential mean reversion trades.
3. **Buying/Selling Pressure Candles:** Look for candles highlighted in light green or red to identify potential buy or sell signals.
4. **Trendlines:** Follow the dynamic trendlines to understand the direction of the current trend.
**Inputs:**
- **Length:** Number of bars to consider for calculating the highest high and lowest low (default: 200).
- **Smooth Length:** Period for the simple moving average to smooth the high and low bands (default: 10).
- **Volume Threshold Multiplier:** Multiplier for the average volume to detect significant buying or selling pressure (default: 1.5).
This indicator is suitable for all timeframes and can be used in conjunction with other technical analysis tools to enhance your trading strategy.
Phát hành các Ghi chú
New designMã nguồn mở
Theo đúng tinh thần TradingView, tác giả của tập lệnh này đã công bố nó dưới dạng mã nguồn mở, để các nhà giao dịch có thể xem xét và xác minh chức năng. Chúc mừng tác giả! Mặc dù bạn có thể sử dụng miễn phí, hãy nhớ rằng việc công bố lại mã phải tuân theo Nội quy.
Thông báo miễn trừ trách nhiệm
Thông tin và các ấn phẩm này không nhằm mục đích, và không cấu thành, lời khuyên hoặc khuyến nghị về tài chính, đầu tư, giao dịch hay các loại khác do TradingView cung cấp hoặc xác nhận. Đọc thêm tại Điều khoản Sử dụng.
Mã nguồn mở
Theo đúng tinh thần TradingView, tác giả của tập lệnh này đã công bố nó dưới dạng mã nguồn mở, để các nhà giao dịch có thể xem xét và xác minh chức năng. Chúc mừng tác giả! Mặc dù bạn có thể sử dụng miễn phí, hãy nhớ rằng việc công bố lại mã phải tuân theo Nội quy.
Thông báo miễn trừ trách nhiệm
Thông tin và các ấn phẩm này không nhằm mục đích, và không cấu thành, lời khuyên hoặc khuyến nghị về tài chính, đầu tư, giao dịch hay các loại khác do TradingView cung cấp hoặc xác nhận. Đọc thêm tại Điều khoản Sử dụng.