OPEN-SOURCE SCRIPT
Volume Stack Emojis

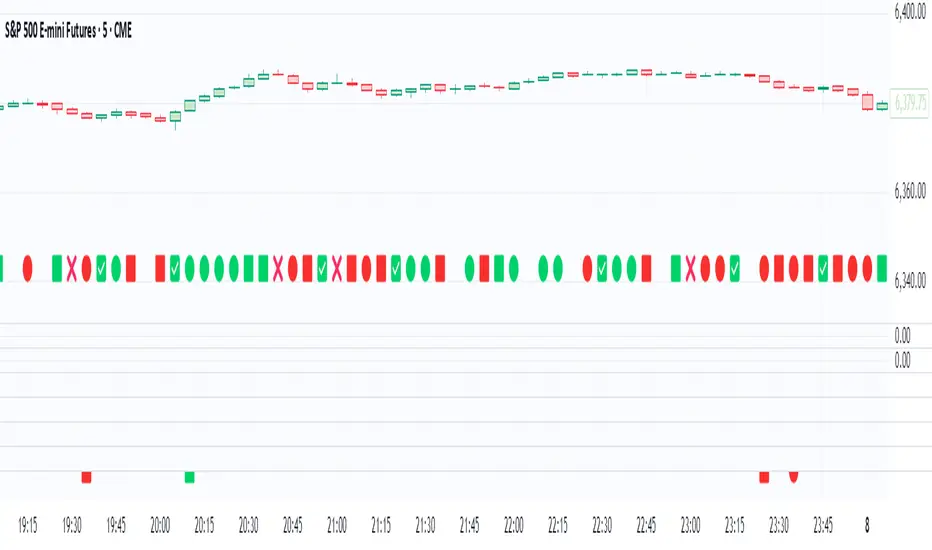
Volume Stack visualizes market bias and momentum for each candle using intuitive emojis in a dedicated bottom pane, keeping your main price chart clean and focused. The indicator analyzes where price closes within each bar’s range to estimate bullish or bearish pressure and highlights key momentum shifts.
Features:
Bullish and Bearish States:
🟩 Green square: Normal bullish candle
🟥 Red square: Normal bearish candle
Strong Bullish/Bearish:
🟢 Green circle: Strong bullish (close near high)
🔴 Red circle: Strong bearish (close near low)
Critical Transitions:
✅ Green checkmark: Bearish → strong bullish (momentum reversal up)
❌ Red cross: Bullish → strong bearish (momentum reversal down)
Easy Visual Scanning:
Emojis plotted in the indicator’s own pane for rapid pattern recognition and clean workflow.
No overlays:
Keeps all symbols off the main price pane.
How it works:
For each candle, the indicator calculates the percentage distance of the close price within the high/low range, then classifies and marks:
Normal bullish/bearish: Basic directional bias
Strong signals: Close is at least 75% toward the high (bullish) or low (bearish)
Transitions: Detects when the market suddenly flips from bullish to strong bearish (❌), or bearish to strong bullish (✅), pinpointing possible inflection points.
This indicator is ideal for traders who want a simple, non-intrusive visualization of intrabar momentum and key reversals—making trend reading and market sentiment effortless.
Mã nguồn mở
Theo đúng tinh thần TradingView, tác giả của tập lệnh này đã công bố nó dưới dạng mã nguồn mở, để các nhà giao dịch có thể xem xét và xác minh chức năng. Chúc mừng tác giả! Mặc dù bạn có thể sử dụng miễn phí, hãy nhớ rằng việc công bố lại mã phải tuân theo Nội quy.
Thông báo miễn trừ trách nhiệm
Thông tin và các ấn phẩm này không nhằm mục đích, và không cấu thành, lời khuyên hoặc khuyến nghị về tài chính, đầu tư, giao dịch hay các loại khác do TradingView cung cấp hoặc xác nhận. Đọc thêm tại Điều khoản Sử dụng.