PROTECTED SOURCE SCRIPT
IKODO Harmonic Patterns
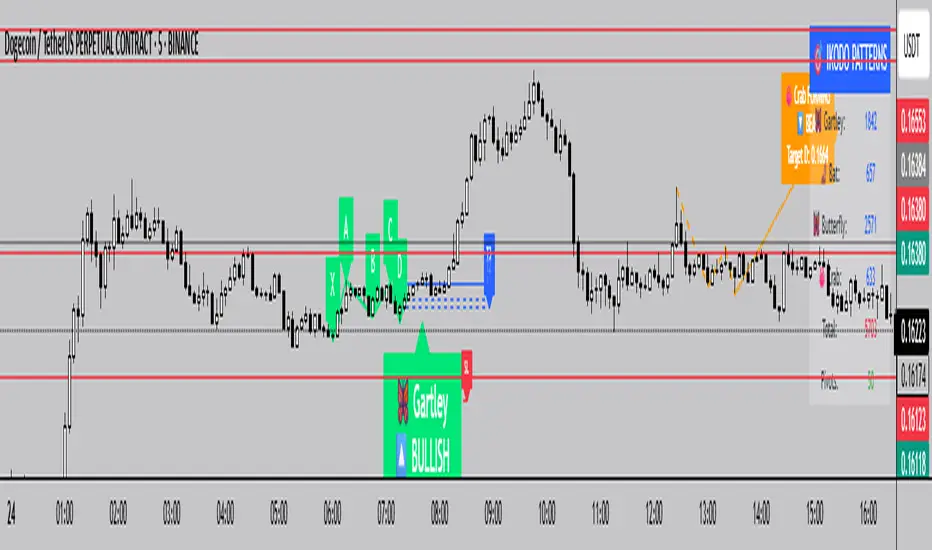
IKODO Harmonic Patterns How its Works
IKODO Harmonic Patterns automatically scans your chart to detect Gartley , Bat , Butterfly , and Crab harmonic patterns in real-time, using strict Fibonacci ratio checks with configurable tolerance and pivot lengths.
Pivot Detection
Uses pivot highs/lows with a configurable length to mark potential turning points on the chart.
Stores and updates the last 50 pivots for performance.
Pattern Identification
Continuously checks for XABCD structures:
Confirms alternating pivot highs/lows.
Calculates XA, AB, BC, CD, AD legs.
Validates Fibonacci ratios within your defined tolerance:
Gartley: AB = 0.618 XA, AD = 0.786 XA
Bat: AB = 0.382/0.5 XA, AD = 0.886 XA
Butterfly: AB = 0.786 XA, AD = 1.272/1.618 XA
Crab: AB = 0.382/0.618 XA, AD = 1.618 XA
Visualization
Draws XABCD lines and labels on your chart.
Displays entry, three target levels (T1, T2, T3), and a stop-loss suggestion for risk management.
Uses color coding:
Green for bullish patterns.
Red for bearish patterns.
Orange for potential (forming) patterns.
Alerts & Table Stats
Generates alerts when a valid pattern completes.
Displays a live table showing:
Count of each pattern type found.
Total patterns detected.
Number of pivots tracked.
Potential Pattern Projection
If a potential pattern is forming (XAB complete, D pending), the indicator:
Projects the potential D point based on Fibonacci extensions.
Marks the path with dotted/dashed lines.
Displays a label with expected D price and pattern type.
Why Use This?
Automates advanced harmonic detection without manual drawing.
Helps in identifying precise reversal points for high-R/R trades.
Supports visual learning of harmonics while trading.
Mã được bảo vệ
Tập lệnh này được đăng dưới dạng mã nguồn đóng. Tuy nhiên, bạn có thể sử dụng tự do và không giới hạn – tìm hiểu thêm tại đây.
Thông báo miễn trừ trách nhiệm
Thông tin và các ấn phẩm này không nhằm mục đích, và không cấu thành, lời khuyên hoặc khuyến nghị về tài chính, đầu tư, giao dịch hay các loại khác do TradingView cung cấp hoặc xác nhận. Đọc thêm tại Điều khoản Sử dụng.