PROTECTED SOURCE SCRIPT
Cập nhật Bank Nifty Indicator by 'Bank Of Nifty'
What is this indicator?
The indicator uses a series of Exponential Moving Averages, their directions and crossovers combined with Parabolic Stop And Reverse (SAR) to determine potential intraday entry points on the BANKNIFTY Index. It uses a long-period EMA to filter the direction of trade. For example, when the price is above the long-period EMA, it only generates Buy signals. It generates signals only between 10AM and 02:30PM IST. It has alert conditions for potential Long/Short Entry triggers.
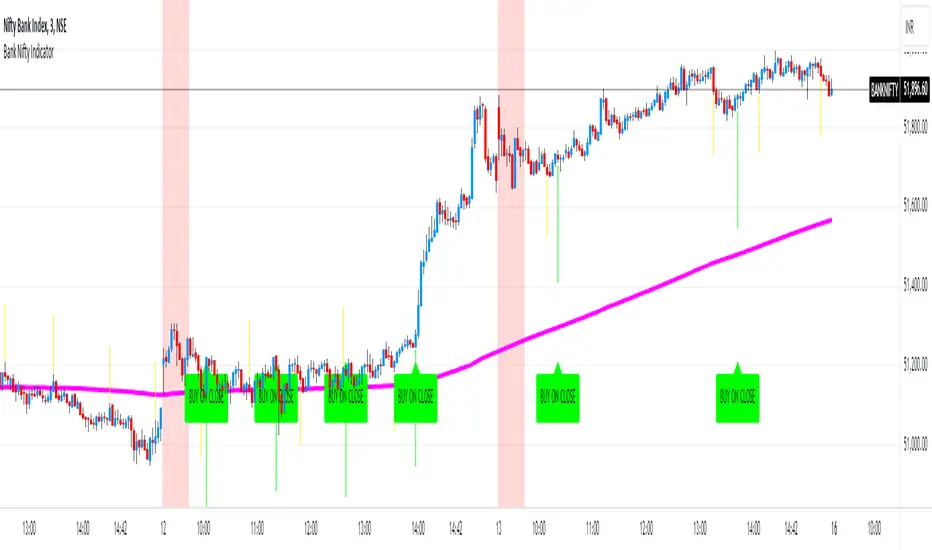
Understanding the indicator plotted on the chart:
- The indicator uses settings that are arrived at after testing multiple conditions. Therefore, it does not allow the user to change these settings as doing so will render the indicator useless.
- EMA Line: One long-period EMA acts as a direction filter for trade signals. If price is above this EMA, only Buy signals are generated and if price is below this EMA, only Sell signals are generated.
- Yellow Arrows: These are early warning signs that a potential entry may be triggering soon. As it uses only some of the entry conditions to predict a potential entry, there can be multiple such signals before an actual signal is generated. These are only meant to be used as alerts and should NEVER be traded individually. Long Warning Alert and Short Warning Alert can be created using the 'Create Alert' dialog box.
- Buy On Close/Sell On Close Signals: These are actual entry triggers that are meant to be traded when confirmed by a candle close.
- Red Background: It indicates the first 30 minutes of the market opening from 9:15AM to 9:45AM.
- Colours for everything appearing on the chart can be customised in settings.
Notes and Usage Guidelines:
- The indicator should only be used on the BANKNIFTY Index for INTRADAY trades.
- For best results, use the 3 Minutes Chart and only trade the day's first signal after a 3 minute candle closes confirming the signal.
- Buy/Sell Signals are only generated between 10AM and 02:30PM.
- These signals work best in trending market conditions. In sideways and range-bound markets, there will be multiple false signals that could lead to losses. Therefore, it is best to limit the number of trades to 1 per day.
Why is this indicator closed source?
This indicator is closed source because it uses a specific combination of settings for indicators that are not available in the public domain, even though the indicators themselves are in the public domain. Keeping it closed source protects these settings from being discovered and as well as preserving them for the indicator to be useful. Without this specific combination of settings and values, the indicator becomes useless.
Disclaimer:
- Trade decisions should NOT be based solely on this indicator. It is meant to aid in confirming a direction bias and act as a confluence to the trader's analysis of the existing market condition.
- The indicator may be updated from time to time to adapt to changed market conditions.
The indicator uses a series of Exponential Moving Averages, their directions and crossovers combined with Parabolic Stop And Reverse (SAR) to determine potential intraday entry points on the BANKNIFTY Index. It uses a long-period EMA to filter the direction of trade. For example, when the price is above the long-period EMA, it only generates Buy signals. It generates signals only between 10AM and 02:30PM IST. It has alert conditions for potential Long/Short Entry triggers.
Understanding the indicator plotted on the chart:
- The indicator uses settings that are arrived at after testing multiple conditions. Therefore, it does not allow the user to change these settings as doing so will render the indicator useless.
- EMA Line: One long-period EMA acts as a direction filter for trade signals. If price is above this EMA, only Buy signals are generated and if price is below this EMA, only Sell signals are generated.
- Yellow Arrows: These are early warning signs that a potential entry may be triggering soon. As it uses only some of the entry conditions to predict a potential entry, there can be multiple such signals before an actual signal is generated. These are only meant to be used as alerts and should NEVER be traded individually. Long Warning Alert and Short Warning Alert can be created using the 'Create Alert' dialog box.
- Buy On Close/Sell On Close Signals: These are actual entry triggers that are meant to be traded when confirmed by a candle close.
- Red Background: It indicates the first 30 minutes of the market opening from 9:15AM to 9:45AM.
- Colours for everything appearing on the chart can be customised in settings.
Notes and Usage Guidelines:
- The indicator should only be used on the BANKNIFTY Index for INTRADAY trades.
- For best results, use the 3 Minutes Chart and only trade the day's first signal after a 3 minute candle closes confirming the signal.
- Buy/Sell Signals are only generated between 10AM and 02:30PM.
- These signals work best in trending market conditions. In sideways and range-bound markets, there will be multiple false signals that could lead to losses. Therefore, it is best to limit the number of trades to 1 per day.
Why is this indicator closed source?
This indicator is closed source because it uses a specific combination of settings for indicators that are not available in the public domain, even though the indicators themselves are in the public domain. Keeping it closed source protects these settings from being discovered and as well as preserving them for the indicator to be useful. Without this specific combination of settings and values, the indicator becomes useless.
Disclaimer:
- Trade decisions should NOT be based solely on this indicator. It is meant to aid in confirming a direction bias and act as a confluence to the trader's analysis of the existing market condition.
- The indicator may be updated from time to time to adapt to changed market conditions.
Phát hành các Ghi chú
Update to fix potential repainting.Phát hành các Ghi chú
Added usage guidelines in Tooltip.Phát hành các Ghi chú
Chart updated.Phát hành các Ghi chú
Chart UpdatedMã được bảo vệ
Tập lệnh này được đăng dưới dạng mã nguồn đóng. Tuy nhiên, bạn có thể sử dụng tự do và không giới hạn – tìm hiểu thêm tại đây.
Thông báo miễn trừ trách nhiệm
Thông tin và các ấn phẩm này không nhằm mục đích, và không cấu thành, lời khuyên hoặc khuyến nghị về tài chính, đầu tư, giao dịch hay các loại khác do TradingView cung cấp hoặc xác nhận. Đọc thêm tại Điều khoản Sử dụng.
Mã được bảo vệ
Tập lệnh này được đăng dưới dạng mã nguồn đóng. Tuy nhiên, bạn có thể sử dụng tự do và không giới hạn – tìm hiểu thêm tại đây.
Thông báo miễn trừ trách nhiệm
Thông tin và các ấn phẩm này không nhằm mục đích, và không cấu thành, lời khuyên hoặc khuyến nghị về tài chính, đầu tư, giao dịch hay các loại khác do TradingView cung cấp hoặc xác nhận. Đọc thêm tại Điều khoản Sử dụng.