OPEN-SOURCE SCRIPT
Cập nhật Average hourly move by @zeusbottrading
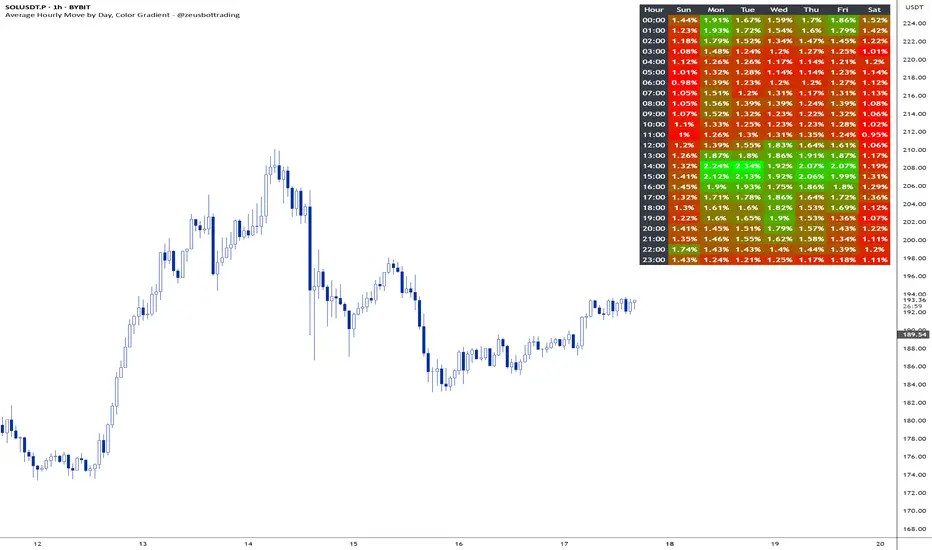
This Pine Script called "Average hourly move by zeusbottrading" calculates and displays the average percentage price movement for each hour of the day using the full available historical data.
How the script works:
It tracks the high and low price within each full hour (e.g., 10:00–10:59).
It calculates the percentage move as the range between high and low relative to the average price during that hour.
For each hour of the day, it stores the total of all recorded moves and the count of occurrences across the full history.
At the end, the script computes the average move for each hour (0 to 23) and determines the minimum and maximum averages.
Using these values, it creates a color gradient, where the hours with the lowest average volatility are red and the highest are green.
It then displays a table in the top-right corner of the chart showing each hour and its average percentage move, color‑coded according to volatility.
What it can be used for:
In short, this script is a useful tool for traders who want to fine‑tune their trading strategies and risk management by analyzing time‑based volatility profiles.
How the script works:
It tracks the high and low price within each full hour (e.g., 10:00–10:59).
It calculates the percentage move as the range between high and low relative to the average price during that hour.
For each hour of the day, it stores the total of all recorded moves and the count of occurrences across the full history.
At the end, the script computes the average move for each hour (0 to 23) and determines the minimum and maximum averages.
Using these values, it creates a color gradient, where the hours with the lowest average volatility are red and the highest are green.
It then displays a table in the top-right corner of the chart showing each hour and its average percentage move, color‑coded according to volatility.
What it can be used for:
- Identifying when the market is historically most volatile or calm during the day.
- Helping plan trade entries and exits based on expected volatility.
- Comparing hourly volatility patterns across different markets or instruments.
- Adjusting position size and risk management according to the anticipated volatility in a particular hour.
- Using long-term historical data to understand recurring daily volatility patterns.
In short, this script is a useful tool for traders who want to fine‑tune their trading strategies and risk management by analyzing time‑based volatility profiles.
Phát hành các Ghi chú
+ option to show days of the week and their hours in detailPhát hành các Ghi chú
+ minor editsMã nguồn mở
Theo đúng tinh thần TradingView, tác giả của tập lệnh này đã công bố nó dưới dạng mã nguồn mở, để các nhà giao dịch có thể xem xét và xác minh chức năng. Chúc mừng tác giả! Mặc dù bạn có thể sử dụng miễn phí, hãy nhớ rằng việc công bố lại mã phải tuân theo Nội quy.
Thông báo miễn trừ trách nhiệm
Thông tin và các ấn phẩm này không nhằm mục đích, và không cấu thành, lời khuyên hoặc khuyến nghị về tài chính, đầu tư, giao dịch hay các loại khác do TradingView cung cấp hoặc xác nhận. Đọc thêm tại Điều khoản Sử dụng.
Mã nguồn mở
Theo đúng tinh thần TradingView, tác giả của tập lệnh này đã công bố nó dưới dạng mã nguồn mở, để các nhà giao dịch có thể xem xét và xác minh chức năng. Chúc mừng tác giả! Mặc dù bạn có thể sử dụng miễn phí, hãy nhớ rằng việc công bố lại mã phải tuân theo Nội quy.
Thông báo miễn trừ trách nhiệm
Thông tin và các ấn phẩm này không nhằm mục đích, và không cấu thành, lời khuyên hoặc khuyến nghị về tài chính, đầu tư, giao dịch hay các loại khác do TradingView cung cấp hoặc xác nhận. Đọc thêm tại Điều khoản Sử dụng.