PROTECTED SOURCE SCRIPT
Cập nhật RSI Price Calculator by eXeTrade ( RSIpc )
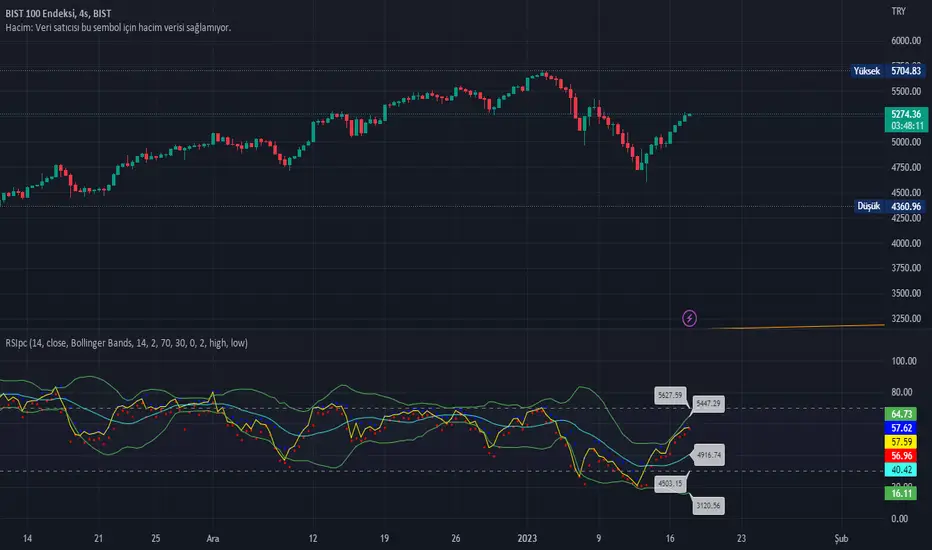
Simply calculates required price to achieve target RSI value.
At standart RSI graph we only see bar close (or selected value like high/low) RSI values but there are spikes at RSI like price bars. There are kown working (resistance or support) RSI levels, you may want to set some orders to these RSI values but it is impossible to set Sell/Buy orders for RSI values at standart brokers. You need price value for target RSI & this calculator calculates this price value for you.
As default it calculates prices for Moving Average & Bollinger Bands (if selected)
User can set Upper & Lower band values (Default as 70 & 30)
Values calculated for active bar.
As example
if RSI upper bollinger working good as resistance you can set sell order at calculated price for upper bollinger.
Phát hành các Ghi chú
RSI spike values added for last bar.If RSI calculation selected from close values all RSI is calculated with close but at this version dotted values show high & low values of RSI.
Calculation example
Close selected for RSI calculation and period (N) =14
Previous 13 bars RSI calculated with close value. Final bar dotted RSI values calculated with high & low for last bar.
Usage
For price graphic some anaysts select spike points for trend analysis but this can not be done with standart RSI. By the help of dots you can do same analysis for RSI.
Mã được bảo vệ
Tập lệnh này được đăng dưới dạng mã nguồn đóng. Tuy nhiên, bạn có thể sử dụng tự do và không giới hạn – tìm hiểu thêm tại đây.
Thông báo miễn trừ trách nhiệm
Thông tin và các ấn phẩm này không nhằm mục đích, và không cấu thành, lời khuyên hoặc khuyến nghị về tài chính, đầu tư, giao dịch hay các loại khác do TradingView cung cấp hoặc xác nhận. Đọc thêm tại Điều khoản Sử dụng.