PROTECTED SOURCE SCRIPT
Cập nhật ENRER RB
rubber band
Phát hành các Ghi chú
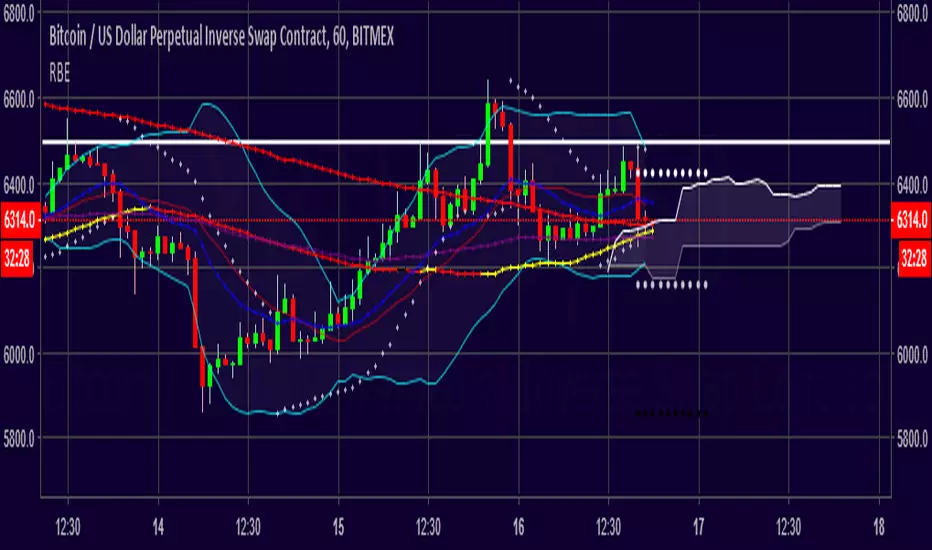
Bollinger Bands : A well known system for defining volatility and Squeeze / expansion
Moving Averages :
SMA 50 (color coded based on direction) for showing the dynamic trend line
EMA 15 for showing local resistance / support lines
SMA 100 and 200 for showing higher time frame resistance/ support or dynamic trend lines
Ichimoko Cloud:
From all the Ichimoko indicator system, it's cloud is one of the best parts to show you the future possible resistance/support zones but it will occlude the chart, so, why not have the needed part?
Parabolic Sar :
One the good indicators to show the shift in the momentum and the power behind it, color coded for easier definition of bullish from bearish
::::: IN NEW V. you can active to show ichimoku lines too ::::::
Phát hành các Ghi chú
Pivot Points And Fibonacci Active from inputs
Mã được bảo vệ
Tập lệnh này được đăng dưới dạng mã nguồn đóng. Tuy nhiên, bạn có thể sử dụng tự do và không giới hạn – tìm hiểu thêm tại đây.
Thông báo miễn trừ trách nhiệm
Thông tin và các ấn phẩm này không nhằm mục đích, và không cấu thành, lời khuyên hoặc khuyến nghị về tài chính, đầu tư, giao dịch hay các loại khác do TradingView cung cấp hoặc xác nhận. Đọc thêm tại Điều khoản Sử dụng.