PROTECTED SOURCE SCRIPT
Cập nhật Kernel Regression Band [dARK]
Introducing The Kernel Regression Band Indicator.
This is a powerful tool designed to assist you in identifying key trends and potential reversals in financial markets. This indicator employs Kernel Regressions, to provide valuable insights into trend dynamics.
Indicator Description:
The Kernel Regression Band Indicator is based on the principles of Kernel Regression analysis, a non-parametric technique widely used in statistical analysis and time series forecasting. It effectively captures and visualizes the underlying trends in price data by smoothing out noisy fluctuations.
Indicator Components:
These two regressions form what I chose to call the Kernel Regression Band.
The Kernel Regression Band Indicator comprises three distinct phases:
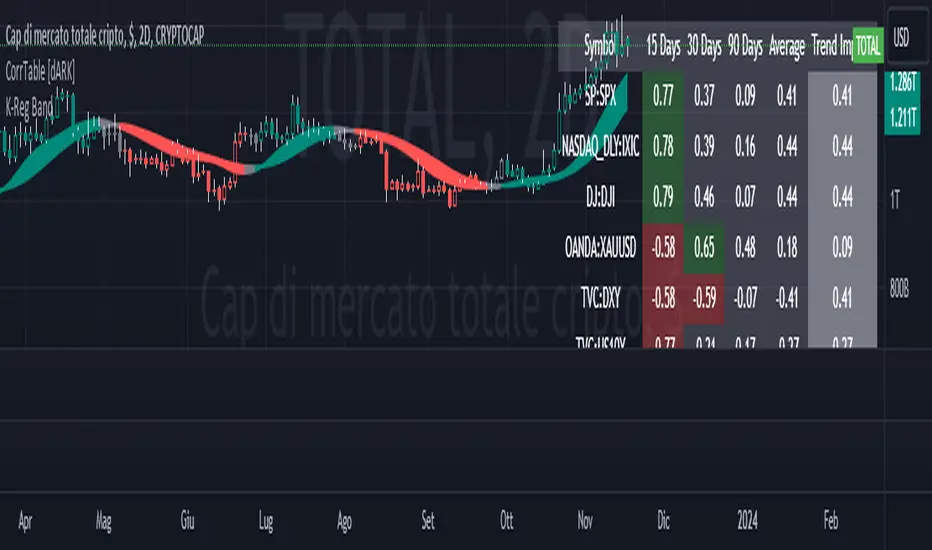
Green Band (Uptrend):
It is colored green when both Kernel Regressions are rising concurrently.
This signals a strong uptrend in the market.
Red Band (Downtrend):
It is colored red when both Kernel Regressions are declining simultaneously.
This indicates a pronounced downtrend in the market.
Grey Zone (Transitional):
The area between the upper and lower bands is colored grey when one Kernel Regression is rising while the other one is declining.
This signifies a transitional phase where market forces are shifting, and uncertainty prevails.
Usage:
You can utilize the Kernel Regression Band Indicator as follows:
Uptrend Confirmation: A green band suggests a strong uptrend, providing a bullish signal to consider long positions or stay invested.
Downtrend Confirmation: A red band indicates a significant downtrend, offering a bearish signal to consider short positions or exit long positions.
Transition Warning: The grey zone serves as a cautionary signal, suggesting that market conditions are in flux, and traders should exercise caution. It can be seen as a warning of potential trend reversals or consolidations.
Keep in mind you can play with settings.
These default ones are pretty good and were used on a 2D chart;
But it's your choice if you want to play with those, to find your best settings.
Enjoy! :)
This is a powerful tool designed to assist you in identifying key trends and potential reversals in financial markets. This indicator employs Kernel Regressions, to provide valuable insights into trend dynamics.
Indicator Description:
The Kernel Regression Band Indicator is based on the principles of Kernel Regression analysis, a non-parametric technique widely used in statistical analysis and time series forecasting. It effectively captures and visualizes the underlying trends in price data by smoothing out noisy fluctuations.
Indicator Components:
- Fast Kernel Regression
- Slow Kernel Regression
These two regressions form what I chose to call the Kernel Regression Band.
The Kernel Regression Band Indicator comprises three distinct phases:
Green Band (Uptrend):
It is colored green when both Kernel Regressions are rising concurrently.
This signals a strong uptrend in the market.
Red Band (Downtrend):
It is colored red when both Kernel Regressions are declining simultaneously.
This indicates a pronounced downtrend in the market.
Grey Zone (Transitional):
The area between the upper and lower bands is colored grey when one Kernel Regression is rising while the other one is declining.
This signifies a transitional phase where market forces are shifting, and uncertainty prevails.
Usage:
You can utilize the Kernel Regression Band Indicator as follows:
Uptrend Confirmation: A green band suggests a strong uptrend, providing a bullish signal to consider long positions or stay invested.
Downtrend Confirmation: A red band indicates a significant downtrend, offering a bearish signal to consider short positions or exit long positions.
Transition Warning: The grey zone serves as a cautionary signal, suggesting that market conditions are in flux, and traders should exercise caution. It can be seen as a warning of potential trend reversals or consolidations.
Keep in mind you can play with settings.
These default ones are pretty good and were used on a 2D chart;
But it's your choice if you want to play with those, to find your best settings.
Enjoy! :)
Phát hành các Ghi chú
Transparency Adjustment Added.Phát hành các Ghi chú
Fixed Typo in description.Mã được bảo vệ
Tập lệnh này được đăng dưới dạng mã nguồn đóng. Tuy nhiên, bạn có thể sử dụng tự do và không giới hạn – tìm hiểu thêm tại đây.
Thông báo miễn trừ trách nhiệm
Thông tin và các ấn phẩm này không nhằm mục đích, và không cấu thành, lời khuyên hoặc khuyến nghị về tài chính, đầu tư, giao dịch hay các loại khác do TradingView cung cấp hoặc xác nhận. Đọc thêm tại Điều khoản Sử dụng.
Mã được bảo vệ
Tập lệnh này được đăng dưới dạng mã nguồn đóng. Tuy nhiên, bạn có thể sử dụng tự do và không giới hạn – tìm hiểu thêm tại đây.
Thông báo miễn trừ trách nhiệm
Thông tin và các ấn phẩm này không nhằm mục đích, và không cấu thành, lời khuyên hoặc khuyến nghị về tài chính, đầu tư, giao dịch hay các loại khác do TradingView cung cấp hoặc xác nhận. Đọc thêm tại Điều khoản Sử dụng.