PROTECTED SOURCE SCRIPT
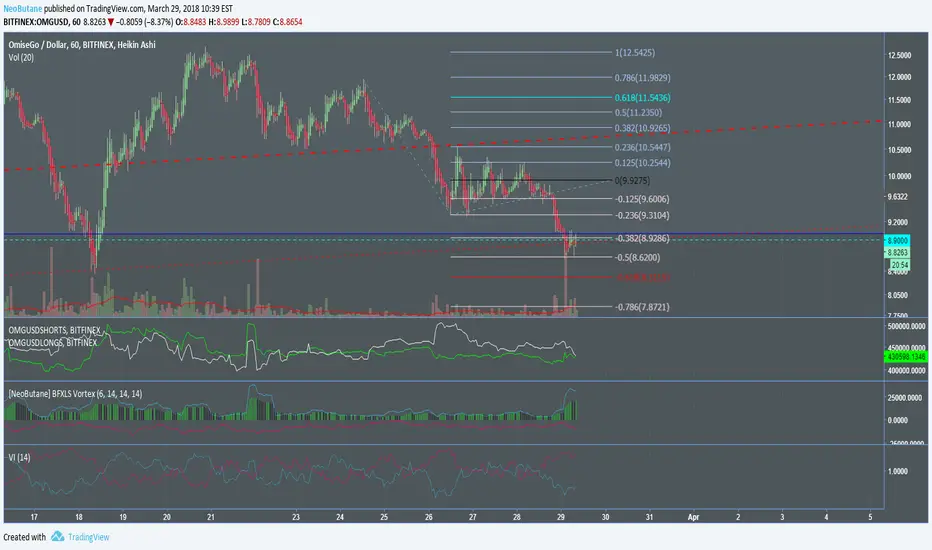
NeoButane Bitfinex BFXLS Vortex Indicator

Scripted longs and shorts to the vortex indicator. It doesn't work like Vortex due to the two plots never crossing to congest.
Blue line: longs
Red line: shorts
Histogram: net volume, ohlc4 of both. Green if previous candle close had lower net volume, black if the previous candle close had more.
Deviance from the histogram: increased volume for the long or short side
Optional ADX line with customizable lookback; it can be difficult to understand due to it being completely horizontal unless you turn off the other plots.
Mã được bảo vệ
Tập lệnh này được đăng dưới dạng mã nguồn đóng. Tuy nhiên, bạn có thể sử dụng tự do và không giới hạn – tìm hiểu thêm tại đây.
My published indicators: tradingview.com/u/NeoButane/
Sorry if I haven't replied to your message yet, I'm a bit backlogged :)
Sorry if I haven't replied to your message yet, I'm a bit backlogged :)
Thông báo miễn trừ trách nhiệm
Thông tin và các ấn phẩm này không nhằm mục đích, và không cấu thành, lời khuyên hoặc khuyến nghị về tài chính, đầu tư, giao dịch hay các loại khác do TradingView cung cấp hoặc xác nhận. Đọc thêm tại Điều khoản Sử dụng.