PROTECTED SOURCE SCRIPT
Keltner Platform

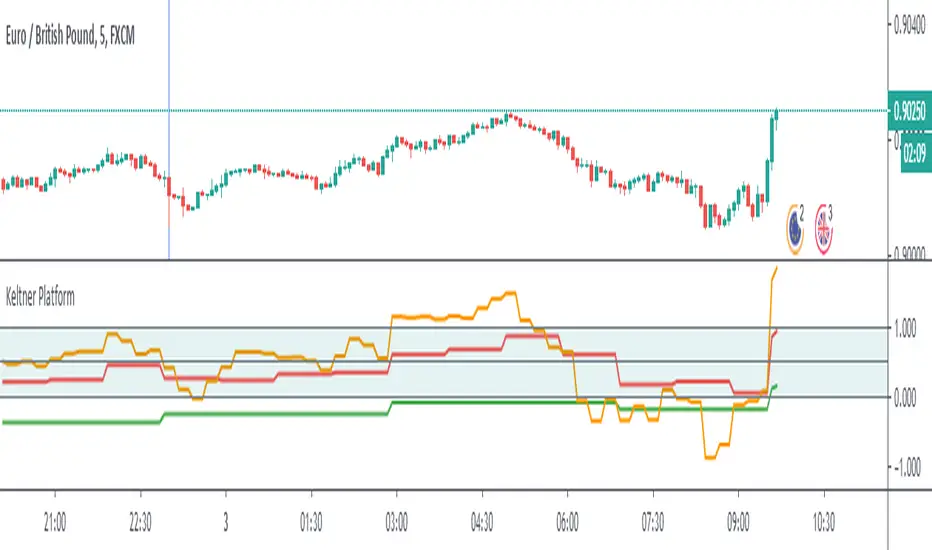
This script gives you the information on Keltner Channels in three or four different timeframes. I usually like to put the information from high-timeframe charts on the lower ones to see the bigger picture without switching. Keltner Platform gives you the idea of how far the price is from its moving average in the true range units.
BLACK - daily
GREEN - 4h
RED - 1h
ORANGE - 15 m if the timeframe is below 1h
How to remember colours? Black is ground, green are plants growing on it, red is the flame, orange is lower temperature flame. This is how they should be settled when all timeframes are in an early uptrend.
You can use different MA types for calculation, simple is recommended (by me).
Have a great trade!
Mã được bảo vệ
Tập lệnh này được đăng dưới dạng mã nguồn đóng. Tuy nhiên, bạn có thể sử dụng tự do và không giới hạn – tìm hiểu thêm tại đây.
Thông báo miễn trừ trách nhiệm
Thông tin và các ấn phẩm này không nhằm mục đích, và không cấu thành, lời khuyên hoặc khuyến nghị về tài chính, đầu tư, giao dịch hay các loại khác do TradingView cung cấp hoặc xác nhận. Đọc thêm tại Điều khoản Sử dụng.