OPEN-SOURCE SCRIPT
QQE MT4
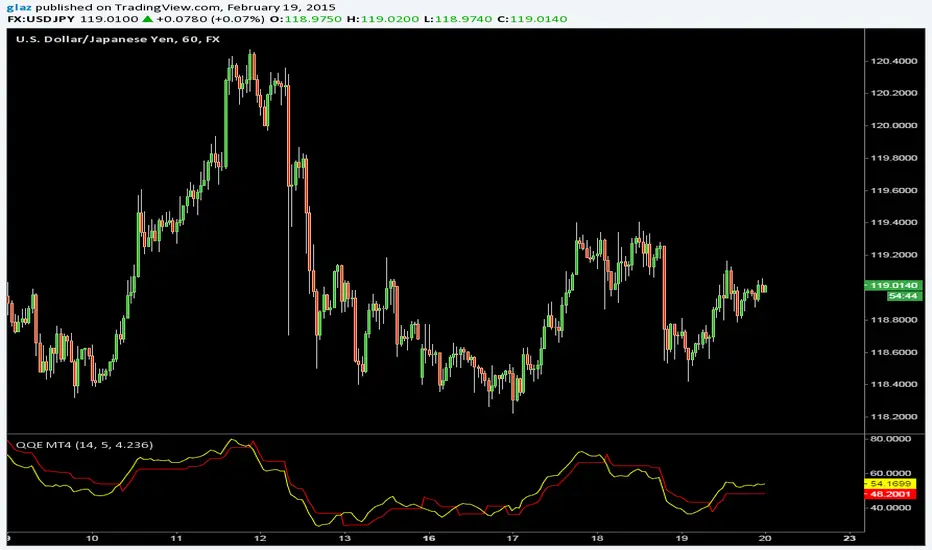
QQE (Quantative Qualitative Estimation) MT4 Version by Roman Ignatov
Another indicator from MT4 to pinescript, from a google search i found the that the original author is unknown and its best used for volatile pairs /JPY
yellow line is a smoothed rsi,
red line "slow trailing stop" is the ATR smoothing with a 14-periods wilders smoothing function that is multiplied by a factor of 4.236
Also big thanks to BlindFreddy, i used part of his supertrend indicator to make it work
Mã nguồn mở
Theo đúng tinh thần TradingView, người tạo ra tập lệnh này đã biến tập lệnh thành mã nguồn mở để các nhà giao dịch có thể xem xét và xác minh công năng. Xin dành lời khen tặng cho tác giả! Mặc dù bạn có thể sử dụng miễn phí, nhưng lưu ý nếu đăng lại mã, bạn phải tuân theo Quy tắc nội bộ của chúng tôi.
Thông báo miễn trừ trách nhiệm
Thông tin và ấn phẩm không có nghĩa là và không cấu thành, tài chính, đầu tư, kinh doanh, hoặc các loại lời khuyên hoặc khuyến nghị khác được cung cấp hoặc xác nhận bởi TradingView. Đọc thêm trong Điều khoản sử dụng.