OPEN-SOURCE SCRIPT
Volume Weighted Standard Deviation (VWSD)
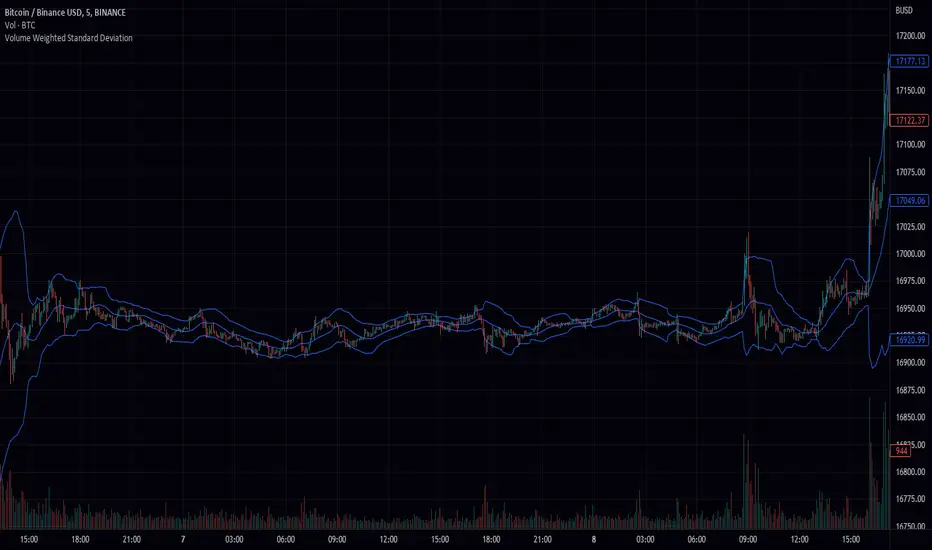
The Volume Weighted Standard Deviation indicator is a custom technical analysis tool that uses the volume of trading to calculate the standard deviation of a stock's price. This indicator takes the source of data, the length of data, and the deviation as inputs, and calculates the volume weighted standard deviation using the values.
The indicator first calculates the mean price and mean volume by using simple moving average over the given length of data. Then it calculates the squared difference between the mean price and the actual price, multiplied by the volume. This gives a volume-weighted squared difference. The indicator then calculates the square root of the sum of the volume-weighted squared differences divided by the sum of the volumes over the given length of data. This gives the volume weighted standard deviation.
The indicator then plots the standard deviation and deviation as a band around the simple moving average of the source data, providing a clear view of the volatility of the stock.
In summary, the Volume Weighted Standard Deviation indicator is a powerful tool for measuring the volatility of a stock by taking into account the volume of trading. It uses the volume of trading to calculate the standard deviation of a stock's price, giving a more accurate representation of the volatility of the stock. It can be useful for traders to identify entry and exit points and make more informed trading decisions.
Mã nguồn mở
Theo đúng tinh thần TradingView, tác giả của tập lệnh này đã công bố nó dưới dạng mã nguồn mở, để các nhà giao dịch có thể xem xét và xác minh chức năng. Chúc mừng tác giả! Mặc dù bạn có thể sử dụng miễn phí, hãy nhớ rằng việc công bố lại mã phải tuân theo Nội quy.
Thông báo miễn trừ trách nhiệm
Thông tin và các ấn phẩm này không nhằm mục đích, và không cấu thành, lời khuyên hoặc khuyến nghị về tài chính, đầu tư, giao dịch hay các loại khác do TradingView cung cấp hoặc xác nhận. Đọc thêm tại Điều khoản Sử dụng.