PROTECTED SOURCE SCRIPT
Support & Resistance Grid
Title: Comprehensive Breakdown of an Advanced Support/Resistance and Liquidity Indicator for Enhanced Trading Performance
Introduction:
In the ever-evolving world of trading, market participants are constantly seeking innovative tools and indicators to enhance their decision-making process and improve their overall trading performance. One such remarkable tool that has gained significant traction amongst traders is an advanced support and resistance (S/R) and liquidity indicator. This powerful indicator offers a plethora of customizable options and unique features, enabling traders to efficiently mark up their charts and identify crucial market levels without the need to spend countless hours on manual analysis.
In this comprehensive breakdown, we will delve into the key features and functionalities of this advanced indicator and demonstrate how traders can leverage it to optimize their trading strategies and achieve better results in the market. While we will not be revealing the source code, we will provide an in-depth explanation of how the indicator performs and the various ways in which it can be used by traders.
Section 1: Support and Resistance Zones - The Backbone of Your Technical Analysis
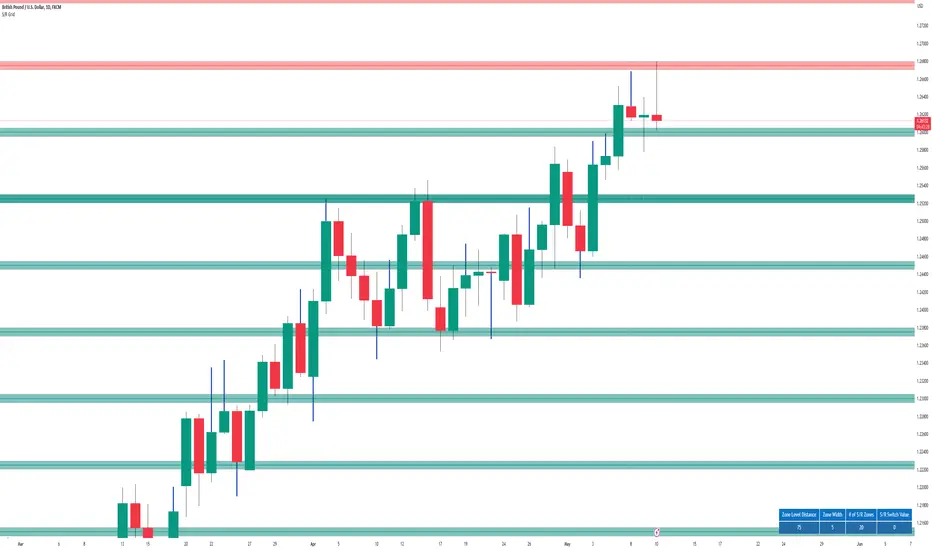
1.1 Automated Chart Marking:
The primary advantage of this advanced indicator is its ability to automatically identify and mark up key support and resistance levels on a chart. Gone are the days when traders had to painstakingly analyze charts and manually mark crucial levels. This indicator saves traders valuable time and ensures a more accurate depiction of S/R zones, ultimately facilitating better-informed trading decisions.
1.2 Round Number Detection:
Another notable feature of this indicator is its ability to detect and highlight psychological levels or round numbers. As these levels often act as significant areas of support or resistance, having them automatically marked on the chart allows traders to concentrate on developing and executing their trading strategies without getting bogged down in the minutiae of identifying these levels.
1.3 Customizable Timeframes:
Recognizing the diverse needs of traders, this advanced indicator offers the flexibility to adjust the user input options and adapt the S/R zones to any timeframe. This functionality allows traders to tailor the indicator to their preferred trading style, whether they are scalping on lower timeframes or taking longer-term positions on higher timeframes.
1.4 Adjustable Pip Difference:
The option to increase or decrease the pip difference between the levels is a game-changer, as it allows traders to easily fine-tune the S/R zones to match the specific behavior of the market across various timeframes. With just a few clicks, traders can increase the pip difference on higher timeframes for a broader perspective, or decrease it on lower timeframes for a more granular view of the market.
1.5 Comprehensive Customization Options:
The advanced S/R indicator boasts a complete range of customizable options, ensuring that traders can tailor it to their unique needs and preferences. With the ability to solely rely on this indicator for marking up their charts, traders can streamline their technical analysis and focus on developing robust trading strategies.
1.6 Anticipating Trades with Limit and Stop Orders:
One of the many ways traders can leverage the S/R zones identified by this indicator is by placing limit and stop orders at these levels. This proactive approach enables traders to be prepared for potential market moves and take advantage of opportunities as they arise, rather than scrambling to react to unexpected price action.
1.7 Identifying Swing Points and Market Trends:
The customizable S/R zones also facilitate the identification of swing points, allowing traders to easily determine the trend direction or recognize ranging markets. This enhanced understanding of market structure can inform trading decisions and improve the overall effectiveness of a trader's strategy.
1.8 Visualization of Swing Points:
The ability to customize the S/R zones not only simplifies the process of identifying swing points but also enhances their visualization. This allows traders to quickly grasp the market structure and make informed decisions based on the prevailing market conditions.
Section 2: Liquidity Wicks - Uncovering Hidden Opportunities in the Market
2.1 Complementing Support and Resistance Zones:
The advanced indicator's liquidity wicks feature serves as an excellent complement to the S/R zones, providing traders with a comprehensive understanding of the market dynamics. By highlighting potential liquidity areas, traders can easily identify high-probability trading opportunities that may have otherwise gone unnoticed.
2.2 Magnetism of Liquidity:
Liquidity in the market often acts as a magnet for price, drawing it towards areas with higher trading volume. By visualizing these liquidity areas through the use of liquidity wicks, traders can anticipate price movements and adjust their strategies accordingly, seizing opportunities as they arise.
2.3 Trading Towards or Bouncing from Liquidity Wicks:
The combination of liquidity wicks and S/R zones empowers traders to take advantage of the market's inherent attraction to liquidity. Traders can either trade towards these wicks, anticipating price to be drawn to the liquidity, or trade based on a bounce from the high or low of the wicks, expecting price to reverse after reaching these areas.
2.4 Synergy of Liquidity Wicks and Support/Resistance Zones:
The relationship between liquidity wicks and S/R zones creates an invaluable synergy for traders. By looking for large liquidity wick bounces from S/R zones, traders can anticipate that price is likely to bounce again, thereby increasing the probability of successful trade execution. This integrated approach enables traders to identify and capitalize on high-probability trading opportunities in a more systematic manner.
Section 3: Bringing It All Together - Maximizing the Potential of the Advanced Indicator
3.1 Customization for Enhanced Trading Performance:
The extensive customization options offered by the advanced indicator allow traders to fine-tune their chart analysis to suit their individual trading styles and preferences. By adjusting the S/R zones, timeframes, and pip differences, traders can achieve an unparalleled level of precision in their technical analysis, ultimately enhancing their overall trading performance.
3.2 Anticipating and Preparing for Market Moves:
The advanced indicator enables traders to anticipate market moves and be prepared for potential opportunities by placing limit and stop orders at crucial levels. This proactive approach minimizes the risk of missing out on profitable trades and allows traders to stay ahead of the market.
3.3 Identifying and Capitalizing on High-Probability Trading Opportunities:
The combination of S/R zones and liquidity wicks empowers traders to identify high-probability trading opportunities and capitalize on them effectively. By integrating these features into their trading strategies, traders can significantly improve their success rate and overall profitability.
Conclusion:
In summary, the advanced support and resistance and liquidity indicator offer traders a powerful tool that can greatly enhance their trading performance. By automatically marking up charts, identifying key levels, and providing customizable options, this indicator allows traders to focus on developing and executing effective trading strategies. The synergy of S/R zones and liquidity wicks further enables traders to uncover hidden opportunities and capitalize on high-probability trades.
By understanding and leveraging the full potential of this advanced indicator, traders can streamline their technical analysis, improve their decision-making process, and ultimately give them a great change to achieve better results in the market.
Introduction:
In the ever-evolving world of trading, market participants are constantly seeking innovative tools and indicators to enhance their decision-making process and improve their overall trading performance. One such remarkable tool that has gained significant traction amongst traders is an advanced support and resistance (S/R) and liquidity indicator. This powerful indicator offers a plethora of customizable options and unique features, enabling traders to efficiently mark up their charts and identify crucial market levels without the need to spend countless hours on manual analysis.
In this comprehensive breakdown, we will delve into the key features and functionalities of this advanced indicator and demonstrate how traders can leverage it to optimize their trading strategies and achieve better results in the market. While we will not be revealing the source code, we will provide an in-depth explanation of how the indicator performs and the various ways in which it can be used by traders.
Section 1: Support and Resistance Zones - The Backbone of Your Technical Analysis
1.1 Automated Chart Marking:
The primary advantage of this advanced indicator is its ability to automatically identify and mark up key support and resistance levels on a chart. Gone are the days when traders had to painstakingly analyze charts and manually mark crucial levels. This indicator saves traders valuable time and ensures a more accurate depiction of S/R zones, ultimately facilitating better-informed trading decisions.
1.2 Round Number Detection:
Another notable feature of this indicator is its ability to detect and highlight psychological levels or round numbers. As these levels often act as significant areas of support or resistance, having them automatically marked on the chart allows traders to concentrate on developing and executing their trading strategies without getting bogged down in the minutiae of identifying these levels.
1.3 Customizable Timeframes:
Recognizing the diverse needs of traders, this advanced indicator offers the flexibility to adjust the user input options and adapt the S/R zones to any timeframe. This functionality allows traders to tailor the indicator to their preferred trading style, whether they are scalping on lower timeframes or taking longer-term positions on higher timeframes.
1.4 Adjustable Pip Difference:
The option to increase or decrease the pip difference between the levels is a game-changer, as it allows traders to easily fine-tune the S/R zones to match the specific behavior of the market across various timeframes. With just a few clicks, traders can increase the pip difference on higher timeframes for a broader perspective, or decrease it on lower timeframes for a more granular view of the market.
1.5 Comprehensive Customization Options:
The advanced S/R indicator boasts a complete range of customizable options, ensuring that traders can tailor it to their unique needs and preferences. With the ability to solely rely on this indicator for marking up their charts, traders can streamline their technical analysis and focus on developing robust trading strategies.
1.6 Anticipating Trades with Limit and Stop Orders:
One of the many ways traders can leverage the S/R zones identified by this indicator is by placing limit and stop orders at these levels. This proactive approach enables traders to be prepared for potential market moves and take advantage of opportunities as they arise, rather than scrambling to react to unexpected price action.
1.7 Identifying Swing Points and Market Trends:
The customizable S/R zones also facilitate the identification of swing points, allowing traders to easily determine the trend direction or recognize ranging markets. This enhanced understanding of market structure can inform trading decisions and improve the overall effectiveness of a trader's strategy.
1.8 Visualization of Swing Points:
The ability to customize the S/R zones not only simplifies the process of identifying swing points but also enhances their visualization. This allows traders to quickly grasp the market structure and make informed decisions based on the prevailing market conditions.
Section 2: Liquidity Wicks - Uncovering Hidden Opportunities in the Market
2.1 Complementing Support and Resistance Zones:
The advanced indicator's liquidity wicks feature serves as an excellent complement to the S/R zones, providing traders with a comprehensive understanding of the market dynamics. By highlighting potential liquidity areas, traders can easily identify high-probability trading opportunities that may have otherwise gone unnoticed.
2.2 Magnetism of Liquidity:
Liquidity in the market often acts as a magnet for price, drawing it towards areas with higher trading volume. By visualizing these liquidity areas through the use of liquidity wicks, traders can anticipate price movements and adjust their strategies accordingly, seizing opportunities as they arise.
2.3 Trading Towards or Bouncing from Liquidity Wicks:
The combination of liquidity wicks and S/R zones empowers traders to take advantage of the market's inherent attraction to liquidity. Traders can either trade towards these wicks, anticipating price to be drawn to the liquidity, or trade based on a bounce from the high or low of the wicks, expecting price to reverse after reaching these areas.
2.4 Synergy of Liquidity Wicks and Support/Resistance Zones:
The relationship between liquidity wicks and S/R zones creates an invaluable synergy for traders. By looking for large liquidity wick bounces from S/R zones, traders can anticipate that price is likely to bounce again, thereby increasing the probability of successful trade execution. This integrated approach enables traders to identify and capitalize on high-probability trading opportunities in a more systematic manner.
Section 3: Bringing It All Together - Maximizing the Potential of the Advanced Indicator
3.1 Customization for Enhanced Trading Performance:
The extensive customization options offered by the advanced indicator allow traders to fine-tune their chart analysis to suit their individual trading styles and preferences. By adjusting the S/R zones, timeframes, and pip differences, traders can achieve an unparalleled level of precision in their technical analysis, ultimately enhancing their overall trading performance.
3.2 Anticipating and Preparing for Market Moves:
The advanced indicator enables traders to anticipate market moves and be prepared for potential opportunities by placing limit and stop orders at crucial levels. This proactive approach minimizes the risk of missing out on profitable trades and allows traders to stay ahead of the market.
3.3 Identifying and Capitalizing on High-Probability Trading Opportunities:
The combination of S/R zones and liquidity wicks empowers traders to identify high-probability trading opportunities and capitalize on them effectively. By integrating these features into their trading strategies, traders can significantly improve their success rate and overall profitability.
Conclusion:
In summary, the advanced support and resistance and liquidity indicator offer traders a powerful tool that can greatly enhance their trading performance. By automatically marking up charts, identifying key levels, and providing customizable options, this indicator allows traders to focus on developing and executing effective trading strategies. The synergy of S/R zones and liquidity wicks further enables traders to uncover hidden opportunities and capitalize on high-probability trades.
By understanding and leveraging the full potential of this advanced indicator, traders can streamline their technical analysis, improve their decision-making process, and ultimately give them a great change to achieve better results in the market.
Mã được bảo vệ
Tập lệnh này được đăng dưới dạng mã nguồn đóng. Tuy nhiên, bạn có thể sử dụng tự do và không giới hạn – tìm hiểu thêm tại đây.
Thông báo miễn trừ trách nhiệm
Thông tin và các ấn phẩm này không nhằm mục đích, và không cấu thành, lời khuyên hoặc khuyến nghị về tài chính, đầu tư, giao dịch hay các loại khác do TradingView cung cấp hoặc xác nhận. Đọc thêm tại Điều khoản Sử dụng.