OPEN-SOURCE SCRIPT
Cập nhật VPA Volume Price Average
Description:
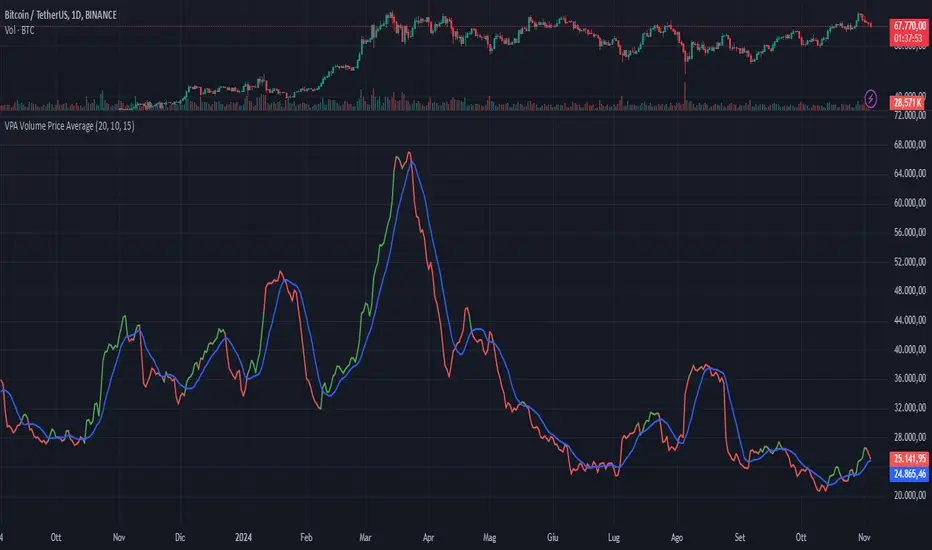
This indicator displays a moving average of volume and its signal line in a separate pane, with conditional highlighting to help interpret buyer and seller pressure. It’s based on two main lines:
Volume Moving Average (red line): represents the average volume calculated over a configurable number of periods.
Signal Line of the Volume Moving Average (blue line): this is an average of the volume moving average itself, used as a reference for volume trends.
Key Features
Volume Moving Average with Conditional Highlighting:
The volume moving average is plotted as a red line and changes color based on two specific conditions:
The closing price is above its moving average, calculated over a configurable number of periods, indicating a bullish trend.
The volume moving average is greater than the signal line, suggesting an increase in buyer pressure.
When both conditions are met, the volume moving average turns green. If one or both conditions are not met, the line remains red.
Signal Line of the Volume Moving Average:
The signal line is plotted in blue and represents a smoothed version of the volume moving average, useful for identifying long-term volume trends and as a reference for the highlighting condition.
Customizable Periods
The indicator allows you to set the periods for each average to adapt to different timeframes and desired sensitivity:
Period for calculating the volume moving average.
Period for calculating the signal line of the volume moving average.
Period for the price moving average (used in the highlighting condition).
How to Use
This indicator is especially useful for monitoring volume dynamics in detail, with a visual system that highlights conditions of increasing buyer strength when the price is in an uptrend. The green highlight on the volume moving average provides an intuitive signal for identifying potential moments of buyer support.
Try it to gain a clearer and more focused view of volume behavior relative to price movement!
Phát hành các Ghi chú
Description:This indicator displays a moving average of volume and its signal line in a separate pane, with conditional highlighting to help interpret buyer and seller pressure. It’s based on two main lines:
Volume Moving Average (red line): represents the average volume calculated over a configurable number of periods.
Signal Line of the Volume Moving Average (blue line): this is an average of the volume moving average itself, used as a reference for volume trends.
Key Features
Volume Moving Average with Conditional Highlighting:
The volume moving average is plotted as a red line and changes color based on two specific conditions:
The closing price is above its moving average, calculated over a configurable number of periods, indicating a bullish trend.
The volume moving average is greater than the signal line, suggesting an increase in buyer pressure.
When both conditions are met, the volume moving average turns green. If one or both conditions are not met, the line remains red.
Signal Line of the Volume Moving Average:
The signal line is plotted in blue and represents a smoothed version of the volume moving average, useful for identifying long-term volume trends and as a reference for the highlighting condition.
Customizable Periods
The indicator allows you to set the periods for each average to adapt to different timeframes and desired sensitivity:
Period for calculating the volume moving average.
Period for calculating the signal line of the volume moving average.
Period for the price moving average (used in the highlighting condition).
How to Use
This indicator is especially useful for monitoring volume dynamics in detail, with a visual system that highlights conditions of increasing buyer strength when the price is in an uptrend. The green highlight on the volume moving average provides an intuitive signal for identifying potential moments of buyer support.
Try it to gain a clearer and more focused view of volume behavior relative to price movement!
Mã nguồn mở
Theo đúng tinh thần TradingView, tác giả của tập lệnh này đã công bố nó dưới dạng mã nguồn mở, để các nhà giao dịch có thể xem xét và xác minh chức năng. Chúc mừng tác giả! Mặc dù bạn có thể sử dụng miễn phí, hãy nhớ rằng việc công bố lại mã phải tuân theo Nội quy.
Thông báo miễn trừ trách nhiệm
Thông tin và các ấn phẩm này không nhằm mục đích, và không cấu thành, lời khuyên hoặc khuyến nghị về tài chính, đầu tư, giao dịch hay các loại khác do TradingView cung cấp hoặc xác nhận. Đọc thêm tại Điều khoản Sử dụng.