PROTECTED SOURCE SCRIPT
Cập nhật Squeeze Zone
This script supports my previous post Empirical Suite
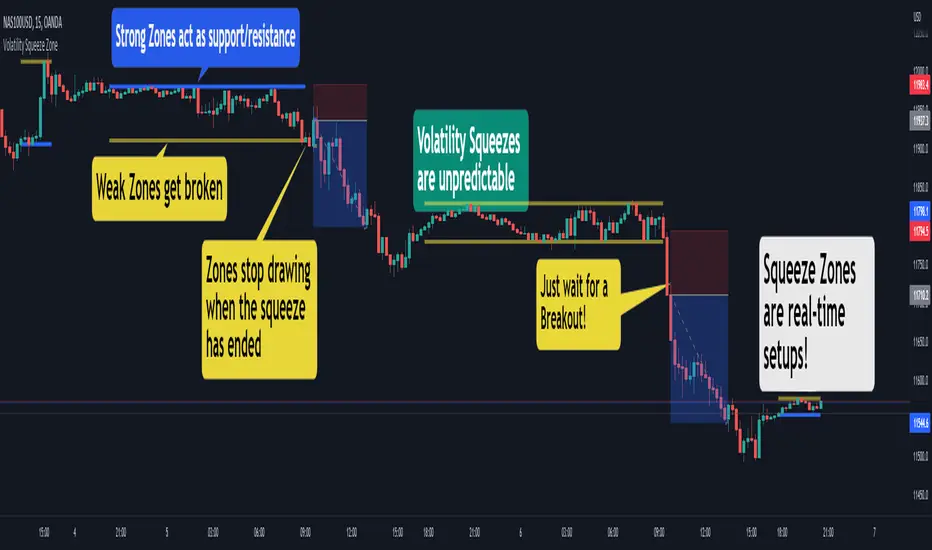
It automatically plots Support and Resistance levels on the chart during periods of volatility squeeze.
You have three plotting methods:
The levels are color-coded:
*Red: weak, one-sided volatility squeeze
*Orange: typically strong, no volatility issue
You can have a double-red zone, where both buying and selling volatility has dropped.
Combine this with the Empirical Suite or your favorite
analysis tools for extra confirmation.
Cheers,
EFX
It automatically plots Support and Resistance levels on the chart during periods of volatility squeeze.
You have three plotting methods:
- From High to Low
- From Open to Close
- Linear Regression (experimental)
The levels are color-coded:
*Red: weak, one-sided volatility squeeze
*Orange: typically strong, no volatility issue
You can have a double-red zone, where both buying and selling volatility has dropped.
Combine this with the Empirical Suite or your favorite
analysis tools for extra confirmation.
Cheers,
EFX
Phát hành các Ghi chú
Updated defaultsRemoved poorly performing settings
Phát hành các Ghi chú
- Upgrade to Pine V5
- Choose your own colors for Zones!
- Improved default settings
Mã được bảo vệ
Tập lệnh này được đăng dưới dạng mã nguồn đóng. Tuy nhiên, bạn có thể sử dụng tự do và không giới hạn – tìm hiểu thêm tại đây.
Algo Trading Simplified 👉 PaxProfits.com
Discover the easy way to manage Forex trading accounts. Trusted by traders globally.
Discover the easy way to manage Forex trading accounts. Trusted by traders globally.
Thông báo miễn trừ trách nhiệm
Thông tin và các ấn phẩm này không nhằm mục đích, và không cấu thành, lời khuyên hoặc khuyến nghị về tài chính, đầu tư, giao dịch hay các loại khác do TradingView cung cấp hoặc xác nhận. Đọc thêm tại Điều khoản Sử dụng.