OPEN-SOURCE SCRIPT
Cập nhật MarketRanger
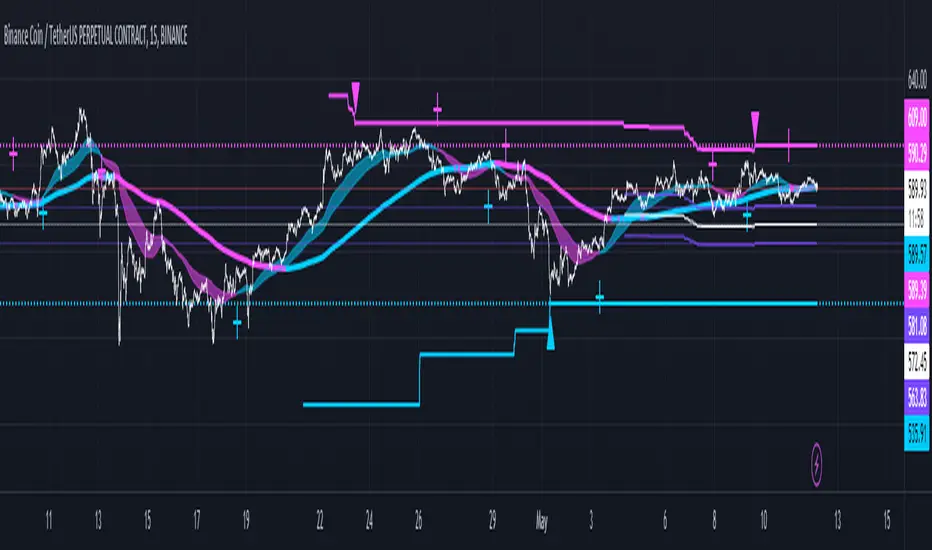
This indicator puts a selection of elements together providing traders with insights into price dynamics, trend changes, and potential trading opportunities within the specified timeframe.
Trading Range Defined by Support and Resistance:
WMA Color Changing based on Slope:
New High/Low Detection:
WMA Crosses:
Slope Changes:
Customizable Pivot Levels:
Usage:
The indicator provides support and resistance levels, new high/low alerts, and WMA crosses.
The midpoint and customizable pivot levels offer potential trading zones.
Slope change points indicate potential shifts in market sentiment.
Customize the pivot levels according to your trading strategy.
Parameters:
Adjust the WMA lengths and support/resistance lengths to suit your trading style.
Modify the visibility settings to control how many periods of support and resistance are displayed.
Customize the pivot levels to fit your preferred trading strategy.
Alerts:
Alerts are triggered for new high/low points and WMA crosses.
Use alerts to stay informed about potential trading opportunities.
Interpretation:
Watch for new high/low points for potential trend reversals or continuations.
Monitor WMA crosses and slope changes for signals of market direction.
Consider trading near support/resistance levels and pivot points.
Additional Notes:
Experiment with different settings to find the configuration that best suits your trading preferences.
Backtest the indicator on historical data to validate its effectiveness before using it in live trading.
Trading Range Defined by Support and Resistance:
- Support and resistance levels are calculated using the lowest low and highest high over specified periods.
- These
WMA Color Changing based on Slope:
- The script uses three Weighted Moving Averages (WMAs) with different lengths.
- The color of the main WMA changes based on its slope.
- When the slope of the WMA is positive (indicating an uptrend), it's displayed in blue. When it's
New High/Low Detection:
- The script detects new highs and lows in the price action.
- A new high is detected when the current high crosses under the previous resistance level, and a new low is detected when the current low crosses over the previous support level.
- These
WMA Crosses:
- The script calculates the difference between the two WMAs.
- When the faster WMA crosses above the slower WMA, indicating a potential bullish signal, a blue cross shape is plotted below the bar.
- When the faster WMA crosses below the slower WMA, indicating a potential bearish signal, a
Slope Changes:
- The script calculates the slope of the main WMA and tracks changes in slope.
- A positive slope indicates an upward trend, while a negative slope indicates a downward trend.
- Slope changes from negative to positive indicate potential bullish momentum, and from
Customizable Pivot Levels:
- Pivot levels are calculated based on user-defined percentages of the range between support and resistance.
- Pivot Level 1 and Pivot Level 2 provide additional reference points for potential reversals or trend continuation.
Usage:
The indicator provides support and resistance levels, new high/low alerts, and WMA crosses.
The midpoint and customizable pivot levels offer potential trading zones.
Slope change points indicate potential shifts in market sentiment.
Customize the pivot levels according to your trading strategy.
Parameters:
Adjust the WMA lengths and support/resistance lengths to suit your trading style.
Modify the visibility settings to control how many periods of support and resistance are displayed.
Customize the pivot levels to fit your preferred trading strategy.
Alerts:
Alerts are triggered for new high/low points and WMA crosses.
Use alerts to stay informed about potential trading opportunities.
Interpretation:
Watch for new high/low points for potential trend reversals or continuations.
Monitor WMA crosses and slope changes for signals of market direction.
Consider trading near support/resistance levels and pivot points.
Additional Notes:
Experiment with different settings to find the configuration that best suits your trading preferences.
Backtest the indicator on historical data to validate its effectiveness before using it in live trading.
Phát hành các Ghi chú
Just made a small modification on support value for a better adjustment. The recomendation is for 15 minPhát hành các Ghi chú
WMA cloud color change addedPhát hành các Ghi chú
properly taggin the name of the WMAsWMA is the main WMA for slope calculation
fast and slow represent the WMAs that are used for the WMA crosses
Mã nguồn mở
Theo đúng tinh thần TradingView, tác giả của tập lệnh này đã công bố nó dưới dạng mã nguồn mở, để các nhà giao dịch có thể xem xét và xác minh chức năng. Chúc mừng tác giả! Mặc dù bạn có thể sử dụng miễn phí, hãy nhớ rằng việc công bố lại mã phải tuân theo Nội quy.
Thông báo miễn trừ trách nhiệm
Thông tin và các ấn phẩm này không nhằm mục đích, và không cấu thành, lời khuyên hoặc khuyến nghị về tài chính, đầu tư, giao dịch hay các loại khác do TradingView cung cấp hoặc xác nhận. Đọc thêm tại Điều khoản Sử dụng.