OPEN-SOURCE SCRIPT
Mswing Homma

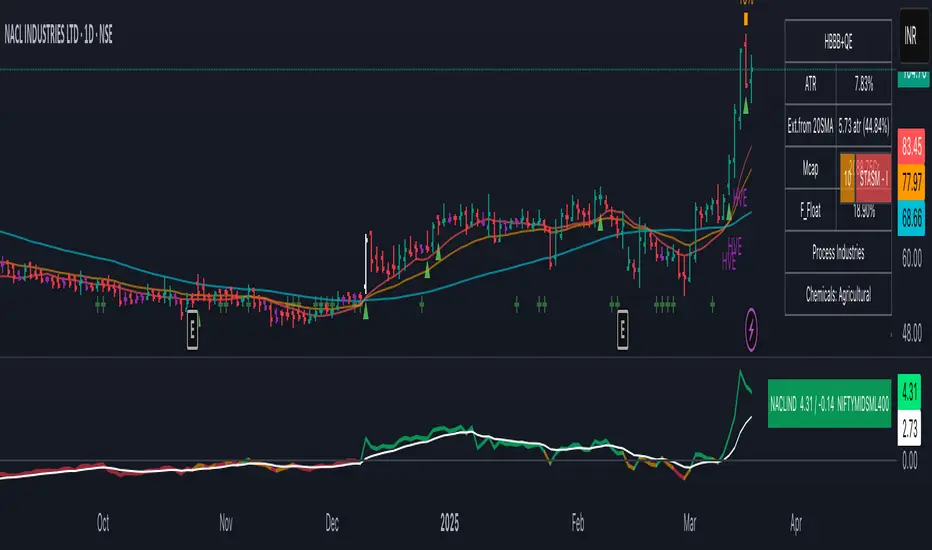
The Mswing is a momentum oscillator that calculates the rate of price change over 20 and 50 periods (days/weeks). Apart from quantifying momentum, it can be used for assessing relative strength, sectoral rotation & entry/exit signals.
Quantifying Momentum Strength
The Mswing's relationship with its EMA (e.g., 5-period or 9-period) is used for momentum analysis:
• M Swing >0 and Above EMA: Momentum is positive and accelerating (ideal for entries).
• M Swing >0 and Below EMA: Momentum is positive but decelerating (caution).
• M Swing <0 and Above EMA: Momentum is negative but improving (watch for reversals).
• M Swing <0 and Below EMA: Momentum is negative and worsening (exit or avoid).
Relative Strength Scanning (M Score)
Sort stocks by their M Swing using TradingView’s Pine scanner.
Compare the Mswing scores of indices/sectors to allocate capital to stronger groups (e.g., renewables vs. traditional energy).
Stocks with strong Mswing scores tend to outperform during bullish phases, while weak ones collapse faster in downtrends.
Entry and Exit Signals
Entry: Buy when Mswing crosses above 0 + price breaks key moving averages (50-day SMA). Use Mswing >0 to confirm valid breakouts. Buy dips when Mswing holds above EMA during retracements.
Exit: Mswing can be used for exiting a stock in 2 ways:
• Sell in Strength: Mswing >4 (overbought).
• Sell in Weakness: Mswing <0 + price below 50-day SMA.
Multi-Timeframe Analysis
• Daily: For swing trades.
• Weekly: For trend confirmation.
• Monthly: For long-term portfolio adjustments.
Mã nguồn mở
Theo đúng tinh thần TradingView, tác giả của tập lệnh này đã công bố nó dưới dạng mã nguồn mở, để các nhà giao dịch có thể xem xét và xác minh chức năng. Chúc mừng tác giả! Mặc dù bạn có thể sử dụng miễn phí, hãy nhớ rằng việc công bố lại mã phải tuân theo Nội quy.
Thông báo miễn trừ trách nhiệm
Thông tin và các ấn phẩm này không nhằm mục đích, và không cấu thành, lời khuyên hoặc khuyến nghị về tài chính, đầu tư, giao dịch hay các loại khác do TradingView cung cấp hoặc xác nhận. Đọc thêm tại Điều khoản Sử dụng.