OPEN-SOURCE SCRIPT
Cập nhật Attrition Scalper v1.0
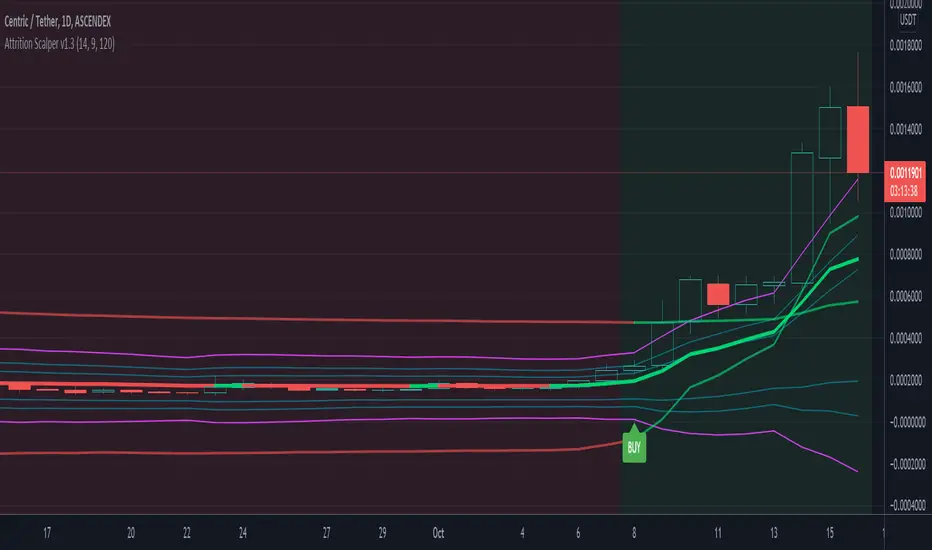
A weird indicator to catch tops/bottoms and scalp with the signals. You should buy/sell with the signals but you should also analyze the chart manually before jumping straight into the trade. One of the most important thing is the middle VIDYA line. It is a very strong support/resistance and if you've taken a long/short from top/bottom, you might want to target there to exit as the indicator will not give you a sell signal there probably.
You should also after trying the indicator for a bit. Make a proper SL/TP strategy for it.
By default the indicator will only load with charts up to 30 minute frame. If you want to load on higher timeframe charts you have to increase the Timeframe to Lookback and the Timeframe options in it's settings.
I really recommend lower timeframes though, the default settings with 5 minute chart is most likely the best.
Each of the lines you see are pretty strong support/resistance and pivot points . So if you've taken an entry for a quick scalp you should most likely start partially closing the position on each line.
I wouldn't really recommend a tight stop as we're most likely entering at or near the bottom and the price really can't stay that overextended unless it's a major/flash dump, at that point no indicator is safe anyways. So finding the sweet spot is up to you.
If more lines are on top of each other, be careful of that spot too as it's a great confluence of support/resistance . For example if the top VIDYA line is near the upper purple 4.236 line. That is a major resistance and if price is above it, it will almost certainly test it back or fall back inside the channel.
Another strategy is to not use the buy/sell signals but use the channel/lines yourself on higher timeframe for swing trading or just putting orders at the other extreme ends/lines in the channel to catch a nice entry in flash/major dumps/pumps.
Price will most likely retrace to the middle VIDYA line after touching or overextending from the top VIDYA and upper purple 4.236 line. Same also applies for the opposite side too. Any close above/below the VIDYA might mean continuation but that's better seen and confirmed on much higher timeframes, not 5 minutes probably.
Special thanks to: tradingview.com/u/RafaelZion... i got inspired from some of his indicators and even used some snippets of code which he allowed me to do.
In the near future i'm thinking of implementing new logic with Weis Waves and few other indicators to increase the signal count as i think it's currently very low. But overtrading might be bad anyways.
Phát hành các Ghi chú
A small addition to not burn ourselves in trending marketPhát hành các Ghi chú
Higher signal count, hopefully without compromising the accuracy and the quality of them.I suggest you use spot exchange charts like Bitstamp/Coinbase etc.
If not for leveraged exchange charts: BitMEX > Bybit > Binance.
Phát hành các Ghi chú
Update to signal logic. Mostly to sell signal.Phát hành các Ghi chú
Added Long Term Support/Resistance Line to better understand the market as we're most likely gonna be in the 5 minute timeframe all the time. Tweaked some default settings and logic.Phát hành các Ghi chú
Buy/Sell Signal Logic completely reworked. Default settings might be a bit choppy, need more testing and feedback whether to keep using it on 5 minute chart or try 15 minute chart with various different "Timeframe to Lookback" setting.
Phát hành các Ghi chú
RSI Support/Resistance LinesPhát hành các Ghi chú
Color changesPhát hành các Ghi chú
Removed a line to clean the look.Phát hành các Ghi chú
RSI lines removed, some changes to the buy/sell signals, they are still mostly terrible.Mã nguồn mở
Theo đúng tinh thần TradingView, tác giả của tập lệnh này đã công bố nó dưới dạng mã nguồn mở, để các nhà giao dịch có thể xem xét và xác minh chức năng. Chúc mừng tác giả! Mặc dù bạn có thể sử dụng miễn phí, hãy nhớ rằng việc công bố lại mã phải tuân theo Nội quy.
Thông báo miễn trừ trách nhiệm
Thông tin và các ấn phẩm này không nhằm mục đích, và không cấu thành, lời khuyên hoặc khuyến nghị về tài chính, đầu tư, giao dịch hay các loại khác do TradingView cung cấp hoặc xác nhận. Đọc thêm tại Điều khoản Sử dụng.
Mã nguồn mở
Theo đúng tinh thần TradingView, tác giả của tập lệnh này đã công bố nó dưới dạng mã nguồn mở, để các nhà giao dịch có thể xem xét và xác minh chức năng. Chúc mừng tác giả! Mặc dù bạn có thể sử dụng miễn phí, hãy nhớ rằng việc công bố lại mã phải tuân theo Nội quy.
Thông báo miễn trừ trách nhiệm
Thông tin và các ấn phẩm này không nhằm mục đích, và không cấu thành, lời khuyên hoặc khuyến nghị về tài chính, đầu tư, giao dịch hay các loại khác do TradingView cung cấp hoặc xác nhận. Đọc thêm tại Điều khoản Sử dụng.