OPEN-SOURCE SCRIPT
Z-Score of RSI
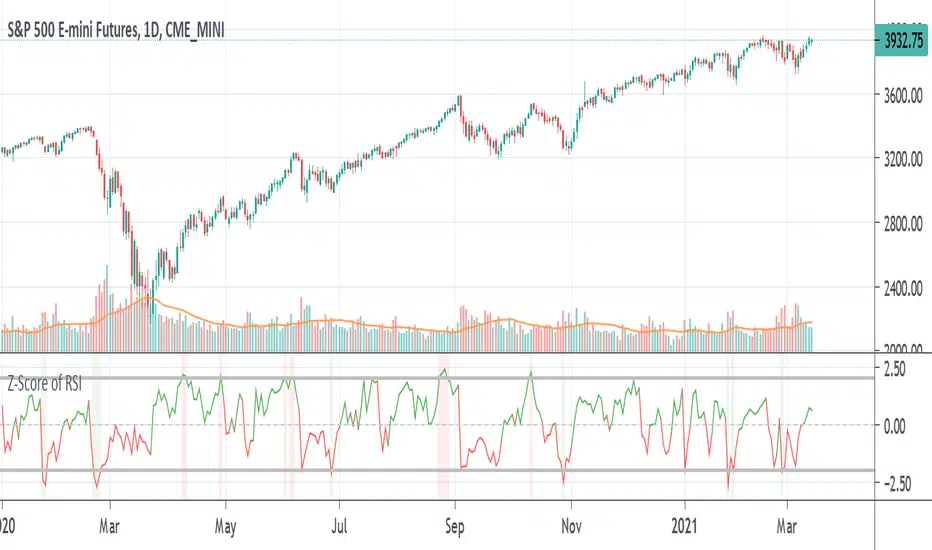
A way to see whether RSI is overbought or oversold inside its Bollinger Bands in the form of an oscillator. Z-score tells you how far the data is from the mean in terms of standard deviations. The numbers shown in the indicator are the number of standard deviations away from the average or mean. Like Bollinger Bands, if it is above the standard deviation border lines then it is considered to be outside the distribution or Bollinger Band. If it is above the upper border line then is it is overbought, if it is below the lower border line then is is oversold.
Example of how standard deviation works: 1 standard deviation contains 68% of the data, 2 SD (the default for BB) contains 95% of data, 3 SD for 99%, etc. If the data goes past that, it is considered to be outside the distribution. In statistics, data that is within the distribution is considered to be "significant".
The z-score line is colored green if it is above zero and red if it is below zero. Above zero means that the RSI is above the average line or the middle line of the Bollinger Bands, and vice-versa if it is below. A red vertical bar is shown when the the z-score is above the upper border line to show that it is overbought and a green vertical bar is shown when the z-score is below the lower border line to show that it is oversold. This is the equivalent of when the RSI is above and below its Bollinger Bands.
Mã nguồn mở
Theo đúng tinh thần TradingView, tác giả của tập lệnh này đã công bố nó dưới dạng mã nguồn mở, để các nhà giao dịch có thể xem xét và xác minh chức năng. Chúc mừng tác giả! Mặc dù bạn có thể sử dụng miễn phí, hãy nhớ rằng việc công bố lại mã phải tuân theo Nội quy.
Thông báo miễn trừ trách nhiệm
Thông tin và các ấn phẩm này không nhằm mục đích, và không cấu thành, lời khuyên hoặc khuyến nghị về tài chính, đầu tư, giao dịch hay các loại khác do TradingView cung cấp hoặc xác nhận. Đọc thêm tại Điều khoản Sử dụng.