PROTECTED SOURCE SCRIPT
Whole Number Levels & Zones
Whole Number Levels & Zones Indicator
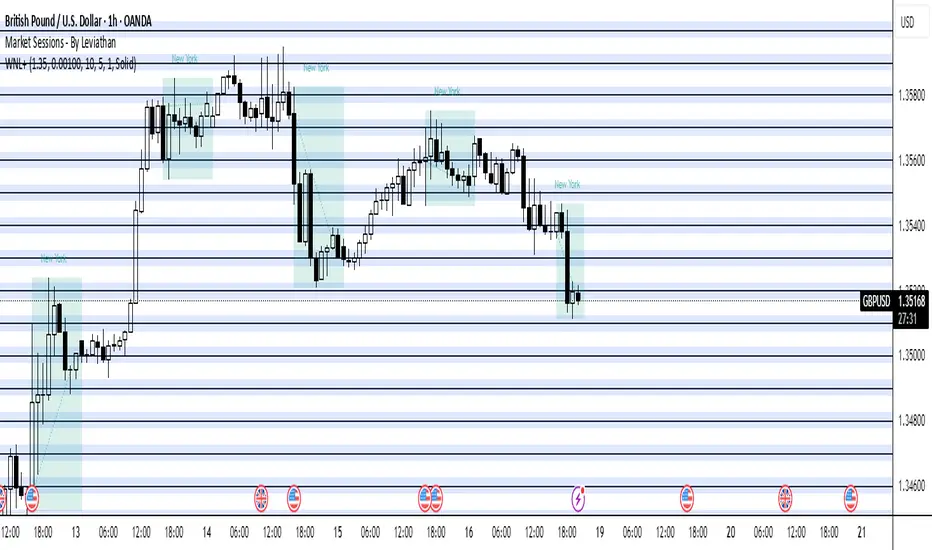
This indicator is designed to automatically plot key psychological price levels on your chart. These are typically round numbers (e.g., 1.35000 on GBP/USD) where trading activity often clusters, creating potential support and resistance.
How It's Used:
Traders use these lines and zones to identify areas where the price might pause, reverse, or break out.
Support: If the price is falling, it may find support and bounce off one of these levels.
Resistance: If the price is rising, it may face resistance and stall at one of these levels.
Confirmation: It can be used alongside other indicators and analysis techniques to confirm trade entries or exits.
Key Features:
Automatic or Manual Levels: You can either let the indicator automatically adjust the lines based on the current price or anchor them to a specific starting price you choose.
Customizable Intervals: You can set the distance between each line (e.g., every 50 or 100 pips).
Shaded Zones: You can enable a shaded box around each line to better visualize the price zones. The height of this box is adjustable.
Full Styling Control: You have complete control over the color, style (dashed, solid, dotted), and thickness of the lines and zones to match your chart's theme.
Mã được bảo vệ
Tập lệnh này được đăng dưới dạng mã nguồn đóng. Tuy nhiên, bạn có thể sử dụng tự do và không giới hạn – tìm hiểu thêm tại đây.
Thông báo miễn trừ trách nhiệm
Thông tin và các ấn phẩm này không nhằm mục đích, và không cấu thành, lời khuyên hoặc khuyến nghị về tài chính, đầu tư, giao dịch hay các loại khác do TradingView cung cấp hoặc xác nhận. Đọc thêm tại Điều khoản Sử dụng.