PROTECTED SOURCE SCRIPT
Displacement Candle Detector
This indicator is designed to automatically identify displacement candles — large, momentum-driven candles that signal strong institutional order flow or the beginning of a market expansion.
It’s particularly useful for Step 3 of your 5-Step Model, where you wait for displacement after a liquidity sweep to confirm directional bias (Buy or Sell).
⚙️ How It Works
Calculates Candle Body Size:
Measures the absolute distance between a candle’s open and close (the real body).
Compares to Average Body (Lookback):
Uses a Simple Moving Average (SMA) of body sizes over the last n candles (default = 5).
This gives the script a baseline for what a “normal” candle looks like.
Defines a Displacement Candle:
When the current candle’s body size is ≥ 1.5× (or user-set multiplier) of the average body, it’s flagged as a displacement candle.
Distinguishes Bullish vs. Bearish Momentum:
Bullish displacement: Close > Open and candle body ≥ 1.5× average
Bearish displacement: Close < Open and candle body ≥ 1.5× average
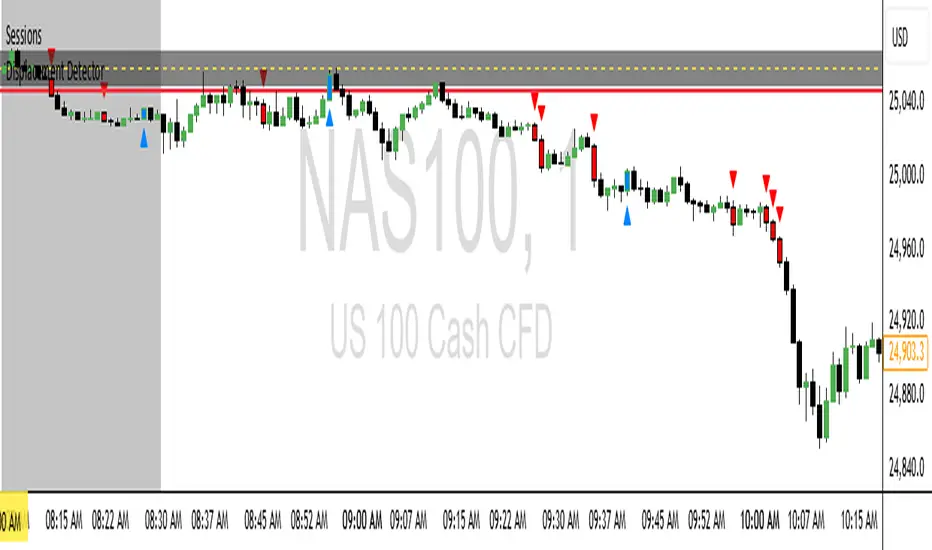
🖥️ What It Displays on Chart
Bar Colors:
Green = Bullish displacement
Red = Bearish displacement
Labels:
Appears above or below the candle (optional toggle).
Helps you easily spot where strong moves originated.
Shapes (Triangles):
Plots a small up/down triangle for each displacement event.
Useful for backtesting, alerts, or pairing with your MSS/FVG setups later.
🧩 Inputs
Setting Description Default
len Lookback period for average body calculation 5
mult Body size multiplier threshold 1.5
showLabels Toggle for displaying candle labels true
showColors Toggle for coloring displacement candles true
🧠 Trading Application
This script acts as your “momentum confirmation filter.”
In your 5-Step Model:
Step 1–2: Wait for liquidity sweep & directional bias.
Step 3: Use this indicator to confirm that displacement (real momentum) occurred.
Step 4–5: Drop to the lower timeframe for MSS confirmation and premium/discount entry.
Once a displacement candle prints, it suggests that:
The side of liquidity swept has been taken,
Institutions are committing volume in the opposite direction,
A Fair Value Gap (FVG) is likely forming for your entry zone.
💡 Pro Tips
Timeframes: Use it on 15m for confirmation, and 1–5m for entry precision.
Multiplier Tuning:
Use 1.3–1.6 for scalping (sensitive).
Use 1.8–2.0 for swing setups (stronger confirmation).
Combine With:
Smart Money Concepts (SMC) Lite for BOS/MSS
FVG Auto-Draw for entry zones
Session Range indicator to visualize liquidity sweeps before displacement.
It’s particularly useful for Step 3 of your 5-Step Model, where you wait for displacement after a liquidity sweep to confirm directional bias (Buy or Sell).
⚙️ How It Works
Calculates Candle Body Size:
Measures the absolute distance between a candle’s open and close (the real body).
Compares to Average Body (Lookback):
Uses a Simple Moving Average (SMA) of body sizes over the last n candles (default = 5).
This gives the script a baseline for what a “normal” candle looks like.
Defines a Displacement Candle:
When the current candle’s body size is ≥ 1.5× (or user-set multiplier) of the average body, it’s flagged as a displacement candle.
Distinguishes Bullish vs. Bearish Momentum:
Bullish displacement: Close > Open and candle body ≥ 1.5× average
Bearish displacement: Close < Open and candle body ≥ 1.5× average
🖥️ What It Displays on Chart
Bar Colors:
Green = Bullish displacement
Red = Bearish displacement
Labels:
Appears above or below the candle (optional toggle).
Helps you easily spot where strong moves originated.
Shapes (Triangles):
Plots a small up/down triangle for each displacement event.
Useful for backtesting, alerts, or pairing with your MSS/FVG setups later.
🧩 Inputs
Setting Description Default
len Lookback period for average body calculation 5
mult Body size multiplier threshold 1.5
showLabels Toggle for displaying candle labels true
showColors Toggle for coloring displacement candles true
🧠 Trading Application
This script acts as your “momentum confirmation filter.”
In your 5-Step Model:
Step 1–2: Wait for liquidity sweep & directional bias.
Step 3: Use this indicator to confirm that displacement (real momentum) occurred.
Step 4–5: Drop to the lower timeframe for MSS confirmation and premium/discount entry.
Once a displacement candle prints, it suggests that:
The side of liquidity swept has been taken,
Institutions are committing volume in the opposite direction,
A Fair Value Gap (FVG) is likely forming for your entry zone.
💡 Pro Tips
Timeframes: Use it on 15m for confirmation, and 1–5m for entry precision.
Multiplier Tuning:
Use 1.3–1.6 for scalping (sensitive).
Use 1.8–2.0 for swing setups (stronger confirmation).
Combine With:
Smart Money Concepts (SMC) Lite for BOS/MSS
FVG Auto-Draw for entry zones
Session Range indicator to visualize liquidity sweeps before displacement.
Mã được bảo vệ
Tập lệnh này được đăng dưới dạng mã nguồn đóng. Tuy nhiên, bạn có thể tự do sử dụng tập lệnh mà không có bất kỳ hạn chế nào – tìm hiểu thêm tại đây.
Thông báo miễn trừ trách nhiệm
Thông tin và ấn phẩm không có nghĩa là và không cấu thành, tài chính, đầu tư, kinh doanh, hoặc các loại lời khuyên hoặc khuyến nghị khác được cung cấp hoặc xác nhận bởi TradingView. Đọc thêm trong Điều khoản sử dụng.