PROTECTED SOURCE SCRIPT
Intraday Market Sentiment @LogicQuest
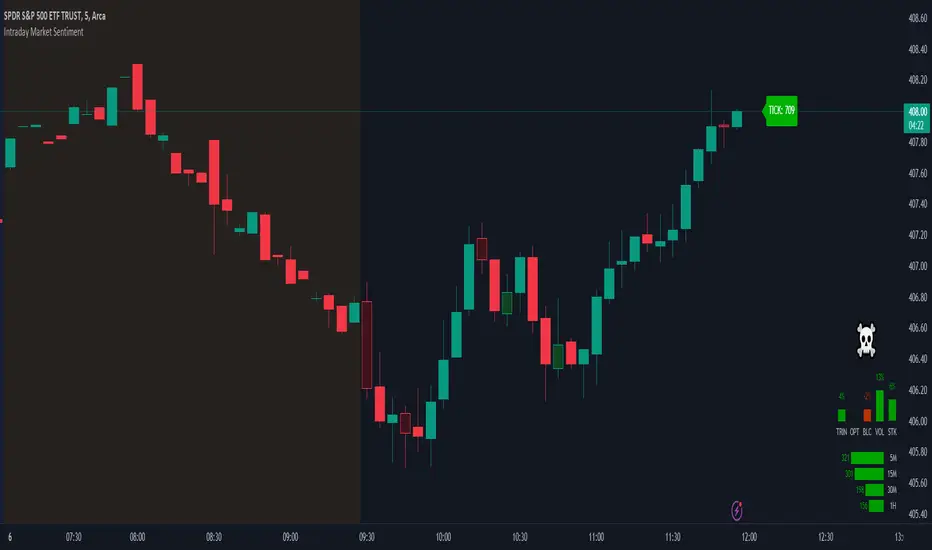
The indicator is designed for use on US stock exchanges during the main trading session. The indicator is a tool for analyzing intraday sentiment in the stock market.
The indicator displays the difference between buying and selling volumes based on the following metrics.
1. TICK - average tick data values for specific time intervals.
2. TRIN (short arbitrage index) - detecting buying and selling pressure and possible trend reversal points.
3. Options - the ratio of purchased and sold option contracts.
4. Blocks - the ratio between the number of shares bought and sold in large blocks.
5. Volumes - the ratio between buying and selling volume.
6. Stocks - the ratio between the number of rising and falling stocks.
7. Price divergence and tick volume.
The data calculation on the chart depends on the settings chosen by the user.
Mã được bảo vệ
Tập lệnh này được đăng dưới dạng mã nguồn đóng. Tuy nhiên, bạn có thể sử dụng tự do và không giới hạn – tìm hiểu thêm tại đây.
Thông báo miễn trừ trách nhiệm
Thông tin và các ấn phẩm này không nhằm mục đích, và không cấu thành, lời khuyên hoặc khuyến nghị về tài chính, đầu tư, giao dịch hay các loại khác do TradingView cung cấp hoặc xác nhận. Đọc thêm tại Điều khoản Sử dụng.