OPEN-SOURCE SCRIPT
Cập nhật Decoding the Volume of candles
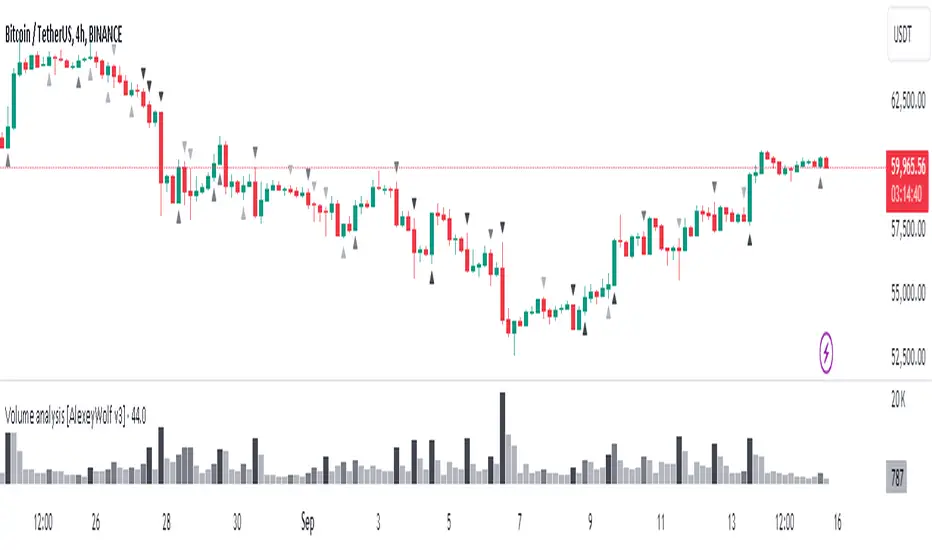
The indicator is designed for traders who are more interested in market structures and price action using volumes. Volume analysis can help traders build a clearer understanding of zones of buyer and seller interest, as well as liquidity gathering points (traders' stop levels).
Key Features:
The indicator visualizes on the chart the volumes selected according to the trader's chosen settings.
The indicator highlights candle volumes in selected colors, where the volume is greater individually than the volumes of the trader's chosen number of preceding candles. Or the volume that is greater than the sum of volumes of the trader's chosen number of preceding candles.
The indicator mark selected volumes on the chart based on the type of candle. The candle type (1, 2, or 3) is determined by its result (close) relative to other candles.
Volume marked for a type 3 candle draws the trader’s attention to the lack of results from the applied volume compared to the previous candle, indicating potential weakness of the candle’s owner. This is especially important in buyer or seller context areas.
Volume marked for a type 2 candle highlights the presence of results from the applied volume but only relative to the previous candle. In buyer or seller context areas, this can signal weakness of the candle’s owner.
Volume marked for a type 1 candle signals a strong result from the applied volume, indicating potential strength of the candle’s owner.
The marking of volumes can be displayed either on the main chart or on the volume chart, depending on the trader's preference. Colors and symbols for marking can be customized on the Style tab.
Volumes can be filtered on both the volume chart and the main chart according to their marking. This feature can be useful, for example, for traders who don’t work with signs of buyer or seller weakness. In such cases, they can filter out volumes only for type 1 candles.
Good luck exploring the impact of volumes on price behavior!
Phát hành các Ghi chú
Explanations of script elementsPhát hành các Ghi chú
Added the ability to set up alerts for volume formation according to the trader's selected settings. If you configure alerts (select the indicator when adding an alert), they will trigger for candle types specified in the Candle type settings.Mã nguồn mở
Theo đúng tinh thần TradingView, tác giả của tập lệnh này đã công bố nó dưới dạng mã nguồn mở, để các nhà giao dịch có thể xem xét và xác minh chức năng. Chúc mừng tác giả! Mặc dù bạn có thể sử dụng miễn phí, hãy nhớ rằng việc công bố lại mã phải tuân theo Nội quy.
Рыночные сценарии, инструкция к индикатору, практические примеры — t.me/ialogic
Market scenarios, indicator guide, practical examples — t.me/initiativeanalysis
Clarity on the Chart. Smart Trading Decisions
Market scenarios, indicator guide, practical examples — t.me/initiativeanalysis
Clarity on the Chart. Smart Trading Decisions
Thông báo miễn trừ trách nhiệm
Thông tin và các ấn phẩm này không nhằm mục đích, và không cấu thành, lời khuyên hoặc khuyến nghị về tài chính, đầu tư, giao dịch hay các loại khác do TradingView cung cấp hoặc xác nhận. Đọc thêm tại Điều khoản Sử dụng.
Mã nguồn mở
Theo đúng tinh thần TradingView, tác giả của tập lệnh này đã công bố nó dưới dạng mã nguồn mở, để các nhà giao dịch có thể xem xét và xác minh chức năng. Chúc mừng tác giả! Mặc dù bạn có thể sử dụng miễn phí, hãy nhớ rằng việc công bố lại mã phải tuân theo Nội quy.
Рыночные сценарии, инструкция к индикатору, практические примеры — t.me/ialogic
Market scenarios, indicator guide, practical examples — t.me/initiativeanalysis
Clarity on the Chart. Smart Trading Decisions
Market scenarios, indicator guide, practical examples — t.me/initiativeanalysis
Clarity on the Chart. Smart Trading Decisions
Thông báo miễn trừ trách nhiệm
Thông tin và các ấn phẩm này không nhằm mục đích, và không cấu thành, lời khuyên hoặc khuyến nghị về tài chính, đầu tư, giao dịch hay các loại khác do TradingView cung cấp hoặc xác nhận. Đọc thêm tại Điều khoản Sử dụng.