PROTECTED SOURCE SCRIPT
VT – Dashboard05
🚀 Overview
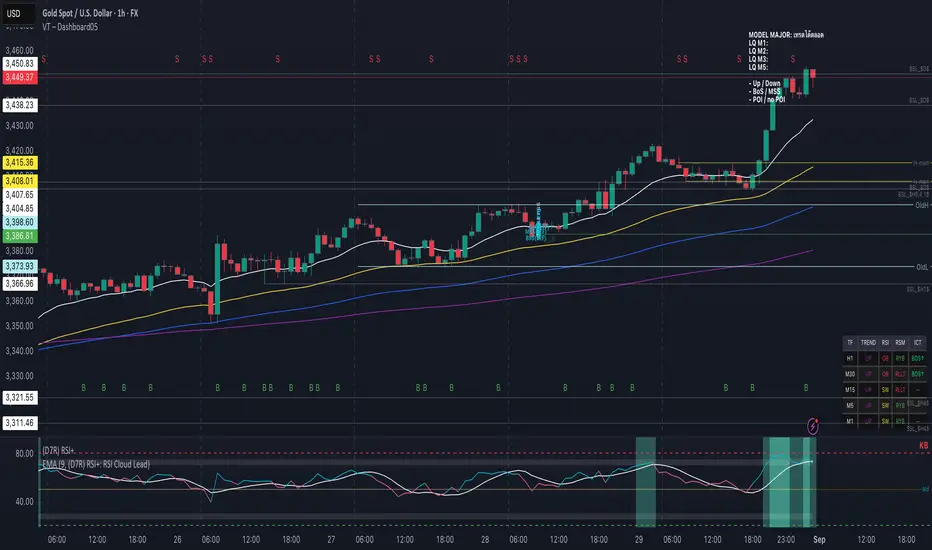
VT – Dashboard05 is a multi-timeframe market state dashboard for Forex and other liquid markets. It summarizes Trend, RSI state, RSM, and ICT structure (BOS/MSS) across H1 / M30 / M15 / M5 / M1 in one compact table—plus clean rejection markers (“S” at the top, “B” at the bottom) controlled entirely from the Style tab. All higher-timeframe values are computed without lookahead and only confirm on their candle close.
✨ Key Features
5-TF Dashboard (H1, M30, M15, M5, M1) — Columns for TREND / RSI / RSM / ICT, color-coded for quick reads.
EMA-Stack Trend — Fast/Mid/Slow EMA alignment for Up / Sideways / Down bias.
RSI & RSM States — OB/OS plus RSI vs RSM momentum (RYB / RLLT).
ICT Structure (BOS / MSS) — Choose Close Break or Body Break; signals confirm only on TF close.
Rejection Markers (Style-only) — “S” at top, “B” at bottom; change colors/visibility in Style (no Inputs clutter).
Alerts — State-change alerts for TREND, RSI, RSM, ICT on each TF, plus rejection alerts on the chart TF.
No repaint tricks — HTF data pulled with gaps filled, lookahead off, confirmation on close.
🛠 How to Use
Add to chart → set Dashboard Position (Inputs).
Pick ICT Break Method (Close Break or Body Break).
Tune Structure Swing Length for H1/M30/M15/M5/M1.
(Optional) Toggle EMA1–EMA4 overlays for context.
Style the markers in Settings → Style:
Rejection (Top) → “S” at top (color/visibility here).
Rejection (Bottom) → “B” at bottom (color/visibility here).
Create alerts using built-in conditions (e.g., ICT change H1, TREND change M15, Rejection Bullish (chart TF)).
⚙️ Settings
Dashboard: Dashboard Position, Compact Mode.
Trend: EMA Fast / Mid / Slow Lengths.
RSI: RSI Length, OB/OS Levels.
RSM: RSM RSI Length, RSM EMA Length.
ICT Structure: ICT Break Method (Close vs Body), Structure Swing Length per TF (H1/M30/M15/M5/M1).
EMAs on Chart: EMA1–EMA4 lengths & show/hide.
Style Tab: Rejection (Top) and Rejection (Bottom) series for color/visibility.
📈 Trading Concepts
TREND: EMA stacking—aligned = UP, mixed = SW, bearish stack = DOWN.
RSI: OB > overbought, OS < oversold, else SW.
RSM: RYB when Uptrend, RLLT when Downtrend.
ICT (BOS/MSS):
BOS↑/BOS↓ = break of last swing high/low.
MSS↑/MSS↓ = break against the prior BOS direction (structure shift).
Signals are evaluated with Close Break or Body Break and confirm only on TF close.
Rejection: Bar-based reversal patterns—“S” marks bearish rejection (top), “B” marks bullish rejection (bottom).
Note: This is a technical analysis tool. Always practice proper risk management and combine with other analysis techniques for best results.
Category: Multi-Timeframe / Dashboard / Structure
Version: 1.0
Developer: VT
Mã được bảo vệ
Tập lệnh này được đăng dưới dạng mã nguồn đóng. Tuy nhiên, bạn có thể tự do sử dụng tập lệnh mà không có bất kỳ hạn chế nào – tìm hiểu thêm tại đây.
Thông báo miễn trừ trách nhiệm
Thông tin và ấn phẩm không có nghĩa là và không cấu thành, tài chính, đầu tư, kinh doanh, hoặc các loại lời khuyên hoặc khuyến nghị khác được cung cấp hoặc xác nhận bởi TradingView. Đọc thêm trong Điều khoản sử dụng.