OPEN-SOURCE SCRIPT
Cập nhật ADR & ATR Extension from EMA

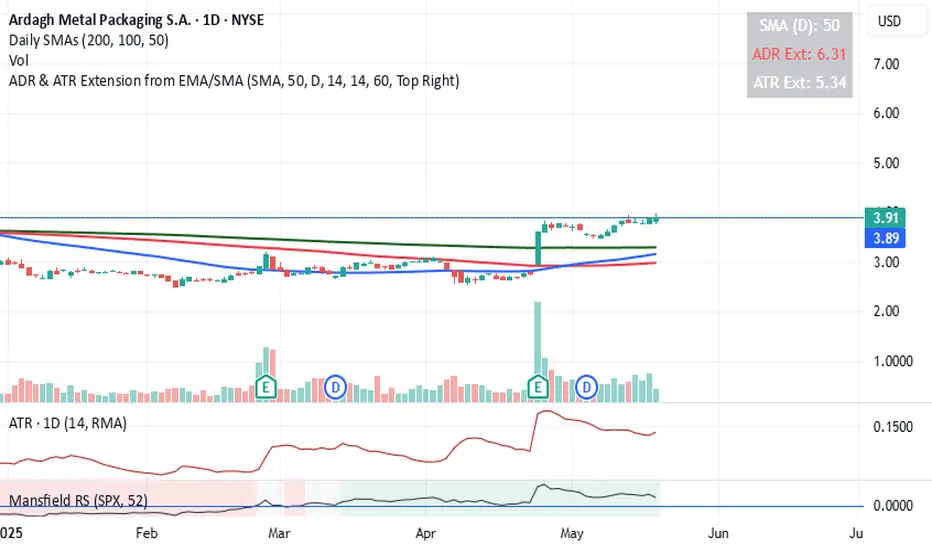
This indicator helps identify how extended the current price is from a chosen Exponential Moving Average (EMA) in terms of both Average Daily Range (ADR) and Average True Range (ATR).
It calculates:
ADR Extension = (Price - EMA) / ADR
ATR Extension = (Price - EMA) / ATR
The results are shown in a floating table on the chart.
The ADR line turns red if the price is more than 4 ADRs above the selected EMA
Customization Options:
- Select EMA length
- Choose between close or high as price input
- Set ADR and ATR periods
- Customize the label’s position, color, and transparency
- Use the chart's timeframe or a fixed timeframe
Phát hành các Ghi chú
This indicator helps identify how extended the current price is from a chosen Moving Average (EMA or SMA) in terms of both Average Daily Range (ADR) and Average True Range (ATR).It calculates:
ADR Extension = (Price - EMA) / ADR
ATR Extension = (Price - EMA) / ATR
The results are shown in a floating table on the chart.
The ADR line turns red if the price is more than 4 ADRs above the selected EMA
Customization Options:
- Select between Exponential and Simple moving average
- Select MA length
- Choose between close or high as price input
- Set ADR and ATR periods
- Customize the label’s position, color, and transparency
- Use the chart's timeframe or a fixed timeframe
Phát hành các Ghi chú
- Bug fixMã nguồn mở
Theo đúng tinh thần TradingView, tác giả của tập lệnh này đã công bố nó dưới dạng mã nguồn mở, để các nhà giao dịch có thể xem xét và xác minh chức năng. Chúc mừng tác giả! Mặc dù bạn có thể sử dụng miễn phí, hãy nhớ rằng việc công bố lại mã phải tuân theo Nội quy.
Thông báo miễn trừ trách nhiệm
Thông tin và các ấn phẩm này không nhằm mục đích, và không cấu thành, lời khuyên hoặc khuyến nghị về tài chính, đầu tư, giao dịch hay các loại khác do TradingView cung cấp hoặc xác nhận. Đọc thêm tại Điều khoản Sử dụng.
Mã nguồn mở
Theo đúng tinh thần TradingView, tác giả của tập lệnh này đã công bố nó dưới dạng mã nguồn mở, để các nhà giao dịch có thể xem xét và xác minh chức năng. Chúc mừng tác giả! Mặc dù bạn có thể sử dụng miễn phí, hãy nhớ rằng việc công bố lại mã phải tuân theo Nội quy.
Thông báo miễn trừ trách nhiệm
Thông tin và các ấn phẩm này không nhằm mục đích, và không cấu thành, lời khuyên hoặc khuyến nghị về tài chính, đầu tư, giao dịch hay các loại khác do TradingView cung cấp hoặc xác nhận. Đọc thêm tại Điều khoản Sử dụng.