OPEN-SOURCE SCRIPT
Stoch Double Analysis MTF
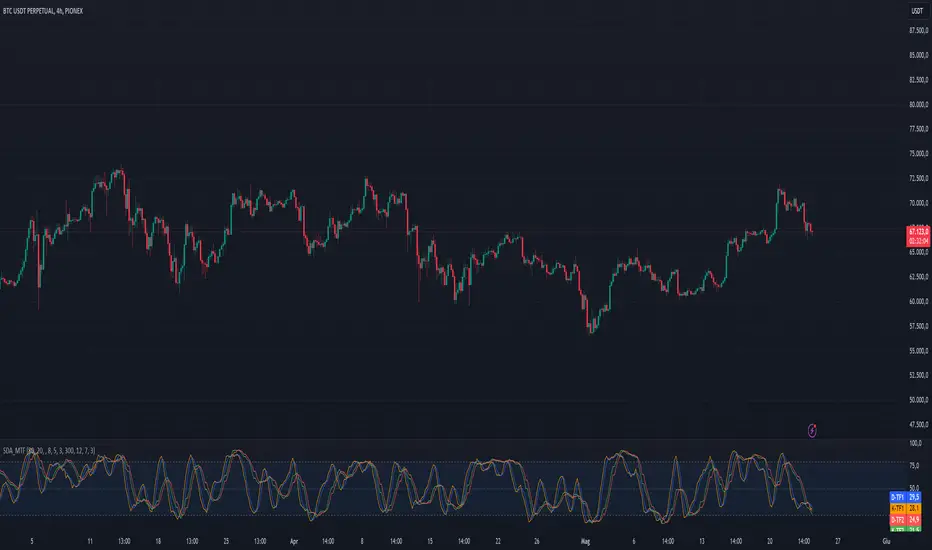
This indicator utilizes the Stochastic Oscillator on two different timeframes and generates alerts for potential long and short conditions based on the crossovers of the %K and %D lines of the Stochastic Oscillator. Here's a detailed breakdown of the code:
Inputs
Overbought and Oversold Levels:
ob_stc: Overbought level (default 80).
os_stc: Oversold level (default 20).
Timeframe 1 Configuration:
tf_stoch_1: The first timeframe for analysis.
length: Stochastic length (default 8).
smoothK: Smoothing for %K line (default 5).
smoothD: Smoothing for %D line (default 3).
Timeframe 2 Configuration:
tf_stoch_2: The second timeframe for analysis.
length_another: Stochastic length for the second timeframe (default 12).
smoothK_another: Smoothing for %K line for the second timeframe (default 7).
smoothD_another: Smoothing for %D line for the second timeframe (default 3).
Calculations
Volume Trend Calculation:
For both timeframes, the script calculates the volume trend. It determines up days and down days based on whether the closing price is higher or lower than the opening price and accumulates the volume accordingly.
Cumulative Volume:
Calculates the cumulative volume for up days and down days using the average of the high prices and the respective volumes.
Stochastic Oscillator Calculation:
Computes the %K and %D lines of the Stochastic Oscillator for both timeframes using the given lengths and smoothing factors.
Alerts
The script generates alerts for potential long and short conditions based on the crossovers of the %K and %D lines for both timeframes:
Long Condition: When %K crosses above %D.
Short Condition: When %D crosses above %K.
Plotting
Stochastic Lines:
Plots the %K and %D lines for both timeframes with different colors (orange and blue for the first timeframe, green and red for the second timeframe).
Overbought/Oversold Bands:
Adds horizontal lines at the overbought and oversold levels and a middle band at 50.
Fills the background between the overbought and oversold levels with a semi-transparent color.
Code Structure
Inputs Definition:
Defines all input variables for customization.
Volume Trend and Cumulative Volume Calculation:
Computes volume trends and cumulative volumes for both timeframes.
Stochastic Oscillator Calculation:
Calculates the %K and %D lines using the request.security function to get data from the specified timeframes and apply the smoothing functions.
Alert Conditions:
Checks for crossovers between the %K and %D lines to generate alerts for potential trading signals.
Plotting:
Plots the %K and %D lines for both timeframes and adds visual elements for overbought and oversold levels.
This indicator helps traders analyze market trends using the Stochastic Oscillator on multiple timeframes, providing potential buy and sell signals based on the interaction of the %K and %D lines.
The alerts generated by the "Stoch Double Analysis MTF" indicator can be viewed as part of a broader educational and training path for traders!
Mã nguồn mở
Theo đúng tinh thần TradingView, tác giả của tập lệnh này đã công bố nó dưới dạng mã nguồn mở, để các nhà giao dịch có thể xem xét và xác minh chức năng. Chúc mừng tác giả! Mặc dù bạn có thể sử dụng miễn phí, hãy nhớ rằng việc công bố lại mã phải tuân theo Nội quy.
Thông báo miễn trừ trách nhiệm
Thông tin và các ấn phẩm này không nhằm mục đích, và không cấu thành, lời khuyên hoặc khuyến nghị về tài chính, đầu tư, giao dịch hay các loại khác do TradingView cung cấp hoặc xác nhận. Đọc thêm tại Điều khoản Sử dụng.