PROTECTED SOURCE SCRIPT
Cập nhật Trend Performance Tracker
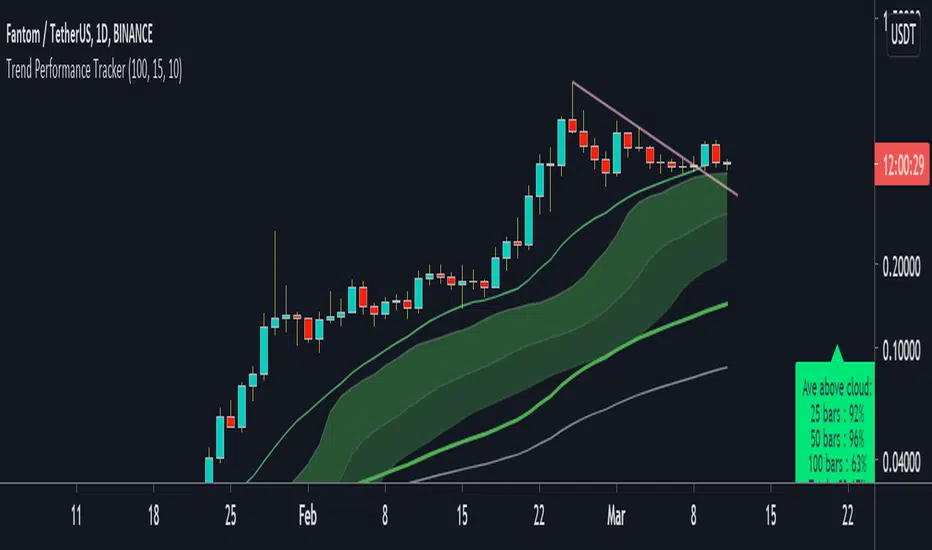
This script is designed for trend trading. Currently set up for stocks long. It's main aim is checking the profitability of the trend trading system that it suggests.
How to use:
- When there is a sufficient trend and pullback for an entry yellow dots will appear under the bars. An buy-stop line (green) and a stop-loss line (red) also appear on the chart at this point.
- the script tracks having made a trade and continues to draw the stop-loss placement on the chart (red line)
- at the bottom of the chart you an see the script tracking the trades it would place.
- Yellow squares are a pending setup
- A green arrow and green squares are a open position
- A pink X means a losing trade and a green flag means a winning trade
- At the current bar will be data on how well the strategy would perform on that pair at that timeframe. "RR" is the total RR made over the number of trades (a bad trade is counted as -1). "win %" is the percentage of winning trades.
- If there RR is > 2 and win % is > 50%, the data box will show as green, indicating a good probability for trading success on that pair and time-frame at that moment.
Phát hành các Ghi chú
Updated the study name to avoid confusionPhát hành các Ghi chú
Minor fix to entryPhát hành các Ghi chú
Updated the RR data box to be out of the way. The X axis bar placement can be set in the options tooPhát hành các Ghi chú
Improved the stop-loss line rulesPhát hành các Ghi chú
Improved trend data to include trend strength and added higher timeframe masPhát hành các Ghi chú
Updated pullback rulesPhát hành các Ghi chú
Updated stop loss to not kick out on the first candlePhát hành các Ghi chú
Updated to include short trend trackingPhát hành các Ghi chú
Fixed sell line updatePhát hành các Ghi chú
Removed entry circles as were clutterPhát hành các Ghi chú
updated to show buy line at last 10 candlesPhát hành các Ghi chú
Minor editPhát hành các Ghi chú
cleaned up scriptPhát hành các Ghi chú
fixed some small detailsPhát hành các Ghi chú
Removes swing high line as not really usefulMã được bảo vệ
Tập lệnh này được đăng dưới dạng mã nguồn đóng. Tuy nhiên, bạn có thể sử dụng tự do và không giới hạn – tìm hiểu thêm tại đây.
Thông báo miễn trừ trách nhiệm
Thông tin và các ấn phẩm này không nhằm mục đích, và không cấu thành, lời khuyên hoặc khuyến nghị về tài chính, đầu tư, giao dịch hay các loại khác do TradingView cung cấp hoặc xác nhận. Đọc thêm tại Điều khoản Sử dụng.
Mã được bảo vệ
Tập lệnh này được đăng dưới dạng mã nguồn đóng. Tuy nhiên, bạn có thể sử dụng tự do và không giới hạn – tìm hiểu thêm tại đây.
Thông báo miễn trừ trách nhiệm
Thông tin và các ấn phẩm này không nhằm mục đích, và không cấu thành, lời khuyên hoặc khuyến nghị về tài chính, đầu tư, giao dịch hay các loại khác do TradingView cung cấp hoặc xác nhận. Đọc thêm tại Điều khoản Sử dụng.