OPEN-SOURCE SCRIPT
EMA Cross Counter
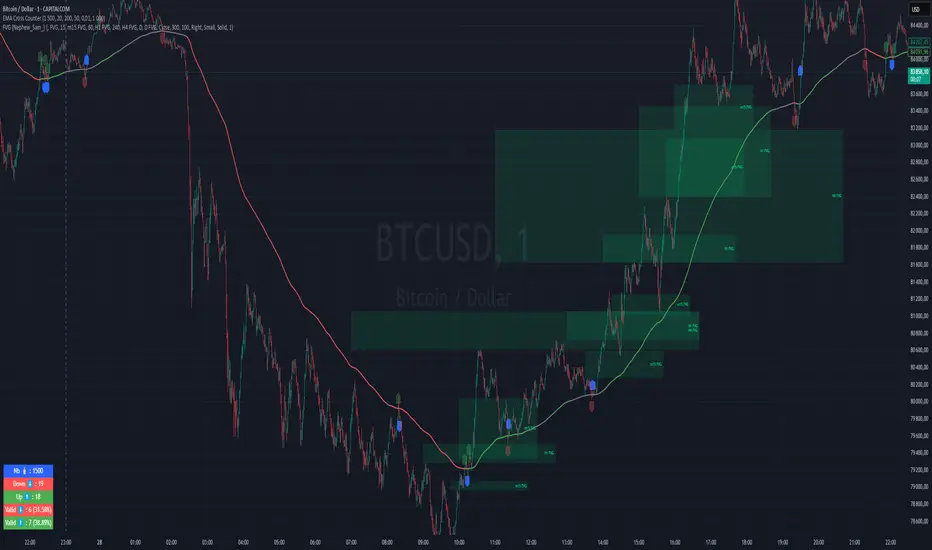
EMA Cross Counter – Trend & Crossover Analyzer
🔥 Description
The EMA Cross Counter is an advanced indicator designed to detect price crossovers with the EMA 200 and provide insightful trend analysis. It highlights valid signals and displays success statistics directly on the chart.
🎯 Key Features
✅ Crossover Detection: Identifies moments when the price crosses the EMA 200 upward or downward.
✅ Signal Filtering: Valid signals (leading to sustained trends) are shown in blue, while invalid signals are faded.
✅ Performance Analysis: A statistics table shows the number of crossovers and their success rate.
✅ Dynamic EMA Coloring:
🟢 Green when the trend is bullish
🔴 Red when the trend is bearish
⚪ Gray when the market is in a range
✅ Range Detection: If the price remains within a narrow range for 30 candles, the EMA turns gray to indicate trend uncertainty.
✅ Stop-Loss (SL) Display: A dashed red line appears below sell signals and above buy signals (adjustable in pips).
✅ Automatic Alerts: Get notified when a significant crossover occurs.
📈 How to Use It?
1️⃣ Look for blue signals as potential trade entries.
2️⃣ Avoid trading when the EMA is gray (ranging market).
3️⃣ Use success rate statistics to evaluate crossover reliability.
4️⃣ Adjust SL distance in the settings to match your risk management strategy.
🛠 Customization Options
Adjustable EMA period
Configurable range threshold
SL distance customizable in pips
Enable/Disable alerts
💡 Ideal for scalping and swing trading, this indicator offers clear trend insights to enhance your decision-making process!
💬 Try it out and share your feedback! 🚀
Mã nguồn mở
Theo đúng tinh thần TradingView, tác giả của tập lệnh này đã công bố nó dưới dạng mã nguồn mở, để các nhà giao dịch có thể xem xét và xác minh chức năng. Chúc mừng tác giả! Mặc dù bạn có thể sử dụng miễn phí, hãy nhớ rằng việc công bố lại mã phải tuân theo Nội quy.
Thông báo miễn trừ trách nhiệm
Thông tin và các ấn phẩm này không nhằm mục đích, và không cấu thành, lời khuyên hoặc khuyến nghị về tài chính, đầu tư, giao dịch hay các loại khác do TradingView cung cấp hoặc xác nhận. Đọc thêm tại Điều khoản Sử dụng.