PROTECTED SOURCE SCRIPT
10Y - 2Y Spread (Farbig)
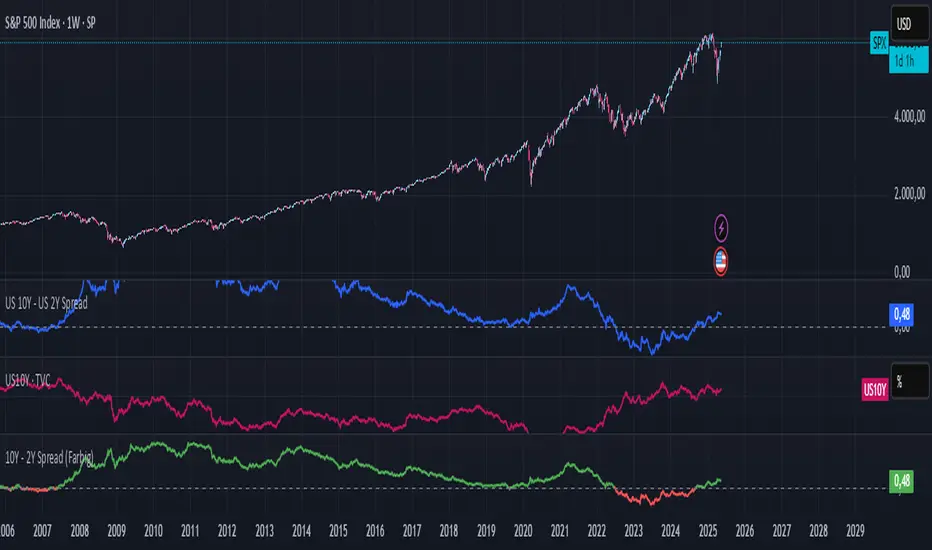
10Y – 2Y Yield Spread (Color-Coded)
Description:
This indicator plots the yield spread between the US 10-Year and 2-Year Treasury yields (US10Y – US02Y) as a color-coded line:
Green = normal yield curve (positive spread)
Red = inverted yield curve (negative spread), often seen as a leading recession signal
A horizontal zero line is added to highlight turning points.
This indicator is ideal for tracking macroeconomic yield curve behavior and can be used alongside equity, crypto, or commodity charts.
Mã được bảo vệ
Tập lệnh này được đăng dưới dạng mã nguồn đóng. Tuy nhiên, bạn có thể sử dụng tự do và không giới hạn – tìm hiểu thêm tại đây.
Thông báo miễn trừ trách nhiệm
Thông tin và các ấn phẩm này không nhằm mục đích, và không cấu thành, lời khuyên hoặc khuyến nghị về tài chính, đầu tư, giao dịch hay các loại khác do TradingView cung cấp hoặc xác nhận. Đọc thêm tại Điều khoản Sử dụng.