OPEN-SOURCE SCRIPT
GP - Long Short Scanner
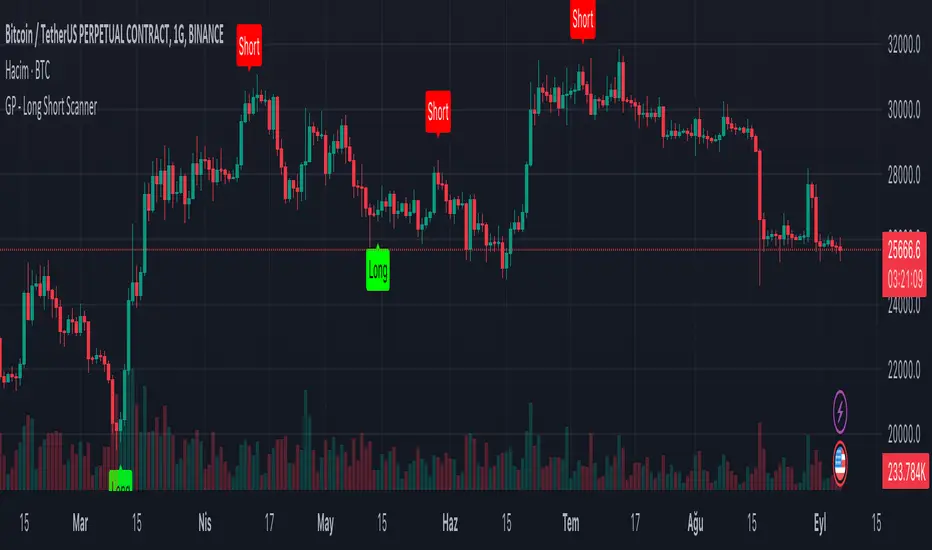
This script is made to predict the point at which price-time charts will rise or fall. The script was inspired by the RSI and TSI formulas. The formula is simply; Calculates the RSI and TSI values of open, high, low and close. Calculated values are converted to an array. The maximum and minimum values in the array are taken for the candles included in the calculation. These values calculate the time when the "Long" label will be seen on the chart of the candle that will increase the price. At the same time, it calculates the time when the "Short" label will appear on the chart of the candle that will decrease the price. Although these calculations are not precise; Seeing the “Long” label means that the price will rise at that candle, and seeing the “Short” label means that the price will decrease at that candle. The “Long”, “Short” tags from this script alone should not be used to determine the direction of the price. It can be used on all price-time charts.
Mã nguồn mở
Theo đúng tinh thần TradingView, tác giả của tập lệnh này đã công bố nó dưới dạng mã nguồn mở, để các nhà giao dịch có thể xem xét và xác minh chức năng. Chúc mừng tác giả! Mặc dù bạn có thể sử dụng miễn phí, hãy nhớ rằng việc công bố lại mã phải tuân theo Nội quy.
Thông báo miễn trừ trách nhiệm
Thông tin và các ấn phẩm này không nhằm mục đích, và không cấu thành, lời khuyên hoặc khuyến nghị về tài chính, đầu tư, giao dịch hay các loại khác do TradingView cung cấp hoặc xác nhận. Đọc thêm tại Điều khoản Sử dụng.