OPEN-SOURCE SCRIPT
Amihud Liquidity Ratio
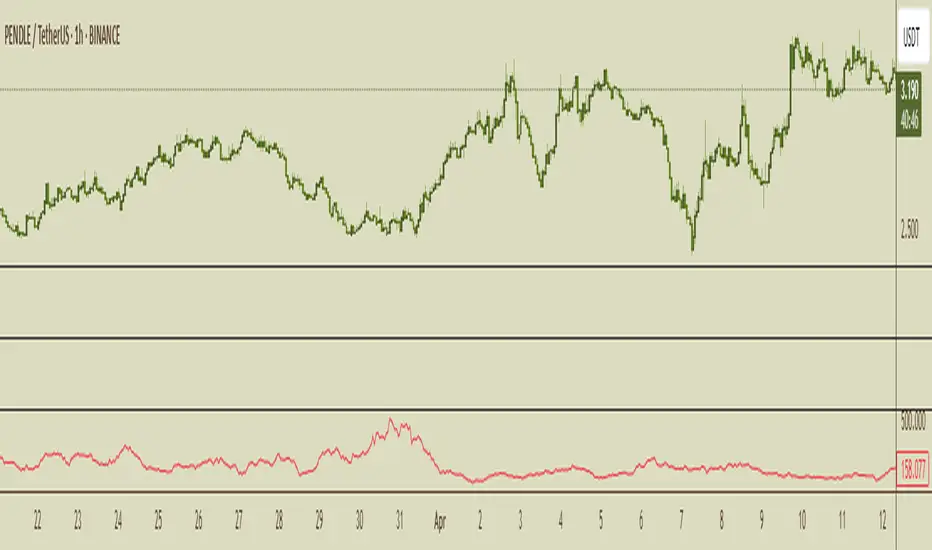
Calculates liquidity as a sort of moving average over time
The Amihud Illiquidity Ratio (ILLIQ) measures the price impact of trading volume. It's calculated as the absolute daily return divided by the daily dollar volume:
𝐼𝐿𝐿𝐼𝑄ₜ = |𝑅ₜ| / 𝑉𝑂𝐿𝐷ₜ
Where:
|𝑅ₜ| is the absolute value on return day t
𝑉𝑂𝐿𝐷ₜ is the dollar trading volume on day t
Here's how you can incorporate this indicator into your analysis:
1. Identifying Liquidity Regimes:
High Liquidity (Low Indicator Values): When the indicator is consistently low, it suggests a market or asset where it's generally easier to enter and exit positions without significant slippage. This might be a more favorable environment for strategies that rely on tight spreads and efficient order execution.
Low Liquidity (High Indicator Values): When the indicator is consistently high or spiking, it signals periods of lower liquidity. This can lead to:
Increased Volatility: Fewer participants and larger bid-ask spreads can amplify price movements.
Higher Slippage: Executing large orders might result in getting a worse price than expected.
Gap Risk: Significant price gaps can occur between trading sessions due to a lack of continuous trading interest.
---------------------------------------------------------------------------------------------------------------------
2. Confirming Trends and Breakouts:
Trend Confirmation:
Uptrend with Increasing Liquidity (Falling Amihud): A healthy uptrend often sees increasing participation and ease of trading. A falling Amihud during an uptrend can provide confidence in the trend's sustainability.
Uptrend with Decreasing Liquidity (Rising Amihud): An uptrend accompanied by rising Amihud might be less stable. It could suggest that the price increase is driven by fewer participants and might be more prone to reversals.
The same logic applies to downtrends, but in reverse.
---------------------------------------------------------------------------------------------------------------------
Breakout Confirmation:
Breakout with Increasing Liquidity (Falling Amihud): A breakout accompanied by increasing liquidity (falling Amihud) can suggest strong conviction and a higher probability of the breakout being sustained.
Breakout with Decreasing Liquidity (Rising Amihud): A breakout on low liquidity might be more suspect and could be a "fakeout" if there isn't enough sustained buying or selling pressure.
---------------------------------------------------------------------------------------------------------------------
3. Identifying Potential Reversal Points:
Liquidity Exhaustion: Sometimes, a prolonged period of low liquidity (high Amihud) might precede a reversal. The lack of active trading interest at those levels could make the price more susceptible to a shift in sentiment.
Liquidity Surges: A sudden spike in liquidity (a sharp drop in Amihud) after a period of low liquidity could indicate renewed interest and potentially the start of a new trend or a reversal of the previous one.
-----------------------------------------------THANK YOU----------------------------------------------------------------------------------------------------------------------------------------------------------------------------------------------------------------------------------<3-----------------------------------------------
Mã nguồn mở
Theo đúng tinh thần TradingView, tác giả của tập lệnh này đã công bố nó dưới dạng mã nguồn mở, để các nhà giao dịch có thể xem xét và xác minh chức năng. Chúc mừng tác giả! Mặc dù bạn có thể sử dụng miễn phí, hãy nhớ rằng việc công bố lại mã phải tuân theo Nội Quy.
Thông báo miễn trừ trách nhiệm
Thông tin và các ấn phẩm này không nhằm mục đích, và không cấu thành, lời khuyên hoặc khuyến nghị về tài chính, đầu tư, giao dịch hay các loại khác do TradingView cung cấp hoặc xác nhận. Đọc thêm tại Điều khoản Sử dụng.