PROTECTED SOURCE SCRIPT
Moving Average for Multiple Timeframes (on 1hr chart)
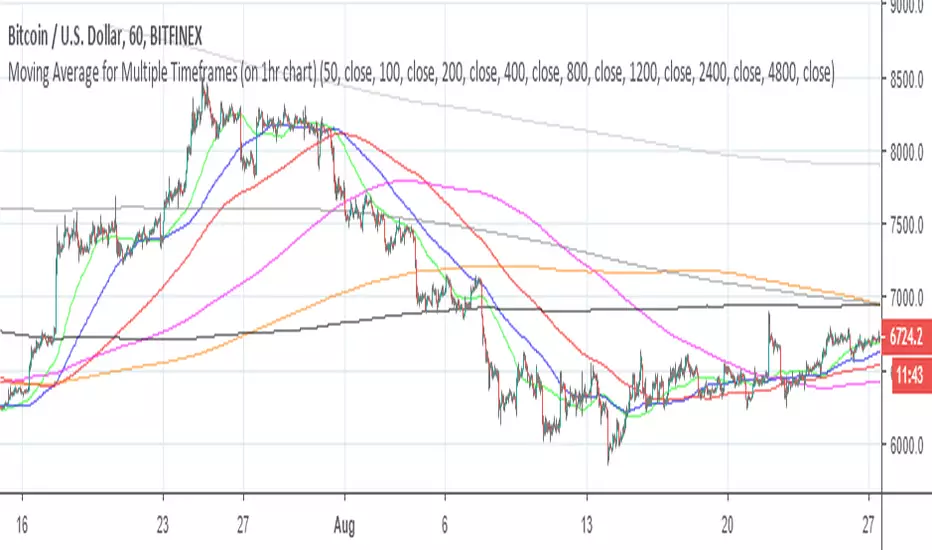
Free to use indicator that displays the 50, 100 and 200 Moving Average for 1 hour, 2 hour, 4 hour and 1 day time frames all at the same time (as long as you are on the 1 hour chart view)
What is a Moving Average?
Smooths out the price across each period to reveal short, medium and long term trends and their relationship to each other. Moving averages can often be expected to act as lines of support and resistance, better allowing you to predict where a price move might stop or falter. The higher the moving average time frame the more significant the support/resistance will be.
Why is this indicator different from other Moving Average scripts?
Usually you can only view the Moving Average for the specific time frame you are viewing, meaning constantly switching (i.e. between the 1 hour and 1 day chart) to look for relevant areas of support/resistance that need to be taken into account. With this indicator, as long as you remain in the 1 hour view, it displays the 50, 100 & 200 MA for multiple time frames all at the same time, revealing crucial support/resistance you might otherwise miss.
When in use, open the settings for the indicator if you need to check the colour of each moving average or wish to change the colour scheme. Add this indicator to your favourites and you might be surprised just how useful it can be.
Please give me a thumbs up if you found this useful. This tool is for educational purposes only and not a recommendation to buy or sell. Always do your own research before trading.
Best wishes,
BCryptological
- Green = 1h 50MA
- Blue = 1h 100MA & 2h 50MA
- Red = 1h 200MA & 2h 100MA & 4h 50MA
- Pink = 2h 200MA & 4h 100MA
- Orange = 4h 200MA
- Light grey = 1D 50MA
- Dark grey = 1D 100MA
- Black = 1D 200MA
What is a Moving Average?
Smooths out the price across each period to reveal short, medium and long term trends and their relationship to each other. Moving averages can often be expected to act as lines of support and resistance, better allowing you to predict where a price move might stop or falter. The higher the moving average time frame the more significant the support/resistance will be.
Why is this indicator different from other Moving Average scripts?
Usually you can only view the Moving Average for the specific time frame you are viewing, meaning constantly switching (i.e. between the 1 hour and 1 day chart) to look for relevant areas of support/resistance that need to be taken into account. With this indicator, as long as you remain in the 1 hour view, it displays the 50, 100 & 200 MA for multiple time frames all at the same time, revealing crucial support/resistance you might otherwise miss.
When in use, open the settings for the indicator if you need to check the colour of each moving average or wish to change the colour scheme. Add this indicator to your favourites and you might be surprised just how useful it can be.
Please give me a thumbs up if you found this useful. This tool is for educational purposes only and not a recommendation to buy or sell. Always do your own research before trading.
Best wishes,
BCryptological
Mã được bảo vệ
Tập lệnh này được đăng dưới dạng mã nguồn đóng. Tuy nhiên, bạn có thể sử dụng tự do và không giới hạn – tìm hiểu thêm tại đây.
Thông báo miễn trừ trách nhiệm
Thông tin và các ấn phẩm này không nhằm mục đích, và không cấu thành, lời khuyên hoặc khuyến nghị về tài chính, đầu tư, giao dịch hay các loại khác do TradingView cung cấp hoặc xác nhận. Đọc thêm tại Điều khoản Sử dụng.