OPEN-SOURCE SCRIPT
%ATR + ΔClose Highlight
Script Overview
This indicator displays on your chart:
Table of the last N bars that passed the ATR-based range filter:
Columns: Bar #, High, Range (High–Low), Low
Summary row: ATR(N), suggested Stop-Loss (SL = X % of ATR), and the current bar’s range as a percentage of ATR
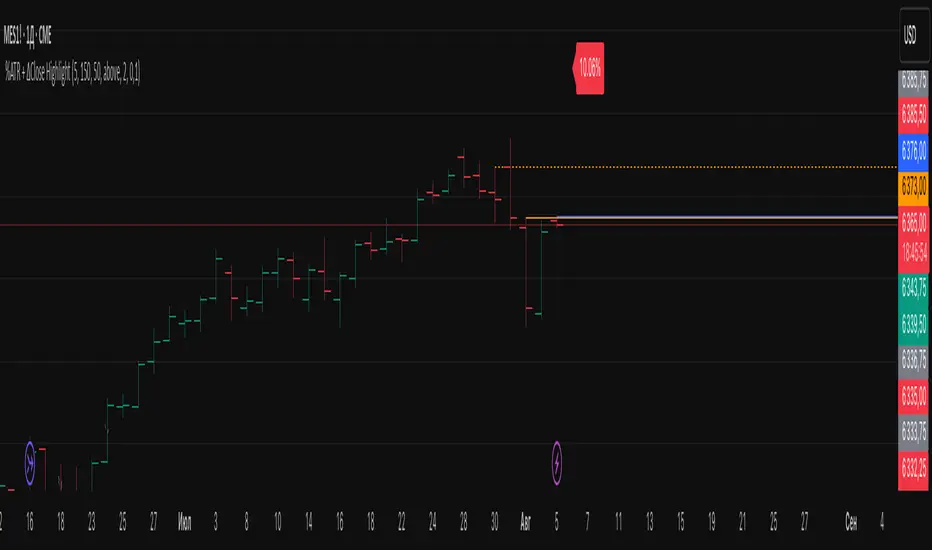
Red badge on the most recent bar showing ΔClose% (the absolute difference between today’s and yesterday’s close, expressed as % of ATR)
Background highlights:
Blue fill under the most recent bar that met the filter
Yellow fill under bars that failed the filter
Hidden plots of ATR, %ATR, and ΔClose% (for use in strategies or alerts)
All table elements, fills, and plots can be toggled off with a single switch so that only the red ΔClose% badge remains visible.
Inputs
Setting Description Default
Length (bars) Lookback period for ATR and range filter (bars) 5
Upper deviation (%) Upper filter threshold (% of average ATR) 150%
Lower deviation (%) Lower filter threshold (% of average ATR) 50%
SL as % of ATR Stop-loss distance (% of ATR) 10%
Label position Table position relative to bar (“above” or “below”) above
Vertical offset (×ATR) Vertical spacing from the bar in ATR units 2.0
Show table & ATR plots Show or hide table, background highlights, and plots true
How It Works
ATR Calculation & Filtering
Computes average True Range over the last N bars.
Marks bars whose daily range falls within the specified upper/lower deviation band.
Table Construction
Gathers up to N most recent bars that passed the filter (or backfills from the most recent pass).
Formats each bar’s High, Low, and Range into fixed-width columns for neat alignment.
Stop-Loss & Percent Metrics
Calculates a recommended SL distance as a percentage of ATR.
Computes today’s bar range and ΔClose (absolute change in close) as % of ATR.
Chart Display
Table: Shows detailed per-bar data and summary metrics.
Background fills: Blue for the latest valid bar, yellow for invalid bars.
Hidden plots: ATR, %ATR, and ΔClose% (useful for backtesting).
Red badge: Always visible on the right side of the last bar, displaying ΔClose%.
Tips
Disable the table & ATR plots to reduce chart clutter—leave only the red ΔClose% badge for a minimalist volatility alert.
Use the hidden ATR fields (plot outputs) in TradingView Strategies or Alerts to automate volatility-based entries/exits.
Adjust the deviation band to capture “normal” intraday moves vs. outsized volatility spikes.
Load this script on any US market chart (stocks, futures, crypto, etc.) to instantly visualize recent volatility structure, set dynamic SL levels, and highlight today’s price change relative to average true range.
This indicator displays on your chart:
Table of the last N bars that passed the ATR-based range filter:
Columns: Bar #, High, Range (High–Low), Low
Summary row: ATR(N), suggested Stop-Loss (SL = X % of ATR), and the current bar’s range as a percentage of ATR
Red badge on the most recent bar showing ΔClose% (the absolute difference between today’s and yesterday’s close, expressed as % of ATR)
Background highlights:
Blue fill under the most recent bar that met the filter
Yellow fill under bars that failed the filter
Hidden plots of ATR, %ATR, and ΔClose% (for use in strategies or alerts)
All table elements, fills, and plots can be toggled off with a single switch so that only the red ΔClose% badge remains visible.
Inputs
Setting Description Default
Length (bars) Lookback period for ATR and range filter (bars) 5
Upper deviation (%) Upper filter threshold (% of average ATR) 150%
Lower deviation (%) Lower filter threshold (% of average ATR) 50%
SL as % of ATR Stop-loss distance (% of ATR) 10%
Label position Table position relative to bar (“above” or “below”) above
Vertical offset (×ATR) Vertical spacing from the bar in ATR units 2.0
Show table & ATR plots Show or hide table, background highlights, and plots true
How It Works
ATR Calculation & Filtering
Computes average True Range over the last N bars.
Marks bars whose daily range falls within the specified upper/lower deviation band.
Table Construction
Gathers up to N most recent bars that passed the filter (or backfills from the most recent pass).
Formats each bar’s High, Low, and Range into fixed-width columns for neat alignment.
Stop-Loss & Percent Metrics
Calculates a recommended SL distance as a percentage of ATR.
Computes today’s bar range and ΔClose (absolute change in close) as % of ATR.
Chart Display
Table: Shows detailed per-bar data and summary metrics.
Background fills: Blue for the latest valid bar, yellow for invalid bars.
Hidden plots: ATR, %ATR, and ΔClose% (useful for backtesting).
Red badge: Always visible on the right side of the last bar, displaying ΔClose%.
Tips
Disable the table & ATR plots to reduce chart clutter—leave only the red ΔClose% badge for a minimalist volatility alert.
Use the hidden ATR fields (plot outputs) in TradingView Strategies or Alerts to automate volatility-based entries/exits.
Adjust the deviation band to capture “normal” intraday moves vs. outsized volatility spikes.
Load this script on any US market chart (stocks, futures, crypto, etc.) to instantly visualize recent volatility structure, set dynamic SL levels, and highlight today’s price change relative to average true range.
Mã nguồn mở
Theo đúng tinh thần TradingView, tác giả của tập lệnh này đã công bố nó dưới dạng mã nguồn mở, để các nhà giao dịch có thể xem xét và xác minh chức năng. Chúc mừng tác giả! Mặc dù bạn có thể sử dụng miễn phí, hãy nhớ rằng việc công bố lại mã phải tuân theo Nội quy.
Thông báo miễn trừ trách nhiệm
Thông tin và các ấn phẩm này không nhằm mục đích, và không cấu thành, lời khuyên hoặc khuyến nghị về tài chính, đầu tư, giao dịch hay các loại khác do TradingView cung cấp hoặc xác nhận. Đọc thêm tại Điều khoản Sử dụng.