OPEN-SOURCE SCRIPT
Cập nhật ABO LANA-𝑀
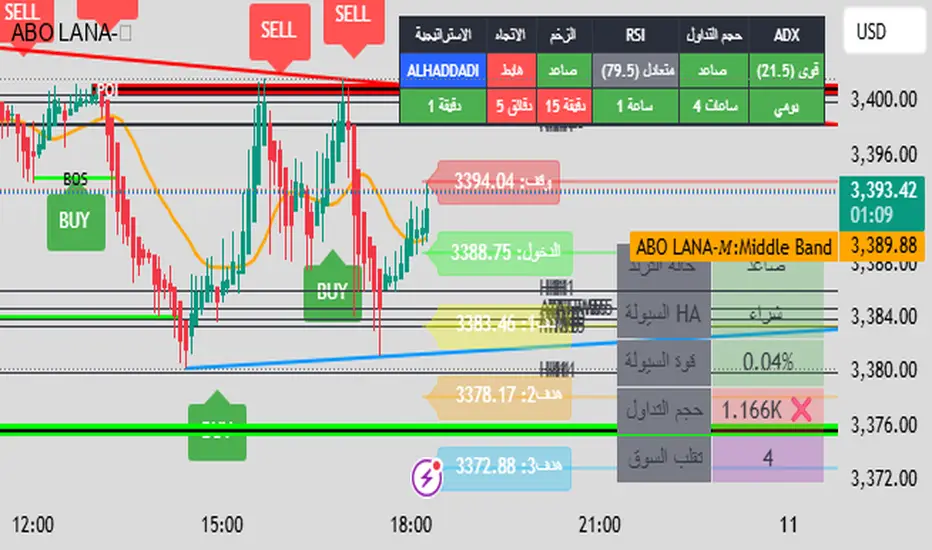
1. إشارات التداول الرئيسية:
إشارة شراء (BUY):
تظهر عند تحول اتجاه السوق من هابط إلى صاعد، مع إغلاق السعر فوق المتوسط المتحرك (EMA 9).
إشارة بيع (SELL):
تظهر عند تحول الاتجاه من صاعد إلى هابط، مع إغلاق السعر تحت المتوسط المتحرك.
2. مناطق العرض والطلب (Supply/Demand):
مناطق العرض (Supply):
تمثل مستويات مقاومة رئيسية (لون أحمر) تُرسم عند القمم السعرية.
مناطق الطلب (Demand):
تمثل مستويات دعم رئيسية (لون أخضر) تُرسم عند القيعان السعرية.
تحديث تلقائي بناءً على حركة السعر وأطر زمنية متعددة.
3. إدارة المخاطر والأرباح:
وقف الخسارة (SL):
يُحسب باستخدام مضاعف ATR (المدى الحقيقي).
مستويات الأرباح (TP1, TP2, TP3):
مستويات ثلاثية للأرباح مع مضاعفات قابلة للتخصيص.
تنبيهات صوتية عند تحقيق كل هدف.
4. لوحة المعلومات (Dashboard):
اتجاه السوق: صاعد/هابط عبر 6 أطر زمنية (من 1 دقيقة إلى يومي).
مؤشر الزخم (Momentum):
اتجاه حركة السعر خلال 10 شمعات.
RSI مخصص:
يجمع بين RSI قصير المدى (2) ومتوسط متحرك (7).
حجم التداول: صاعد/هابط مقارنة بالمتوسط.
قوة الترند (ADX): قوي/ضعيف.
5. ميزات إضافية:
خطوط اتجاه ديناميكية:
تُرسم تلقائياً بين القمم والقيعان.
مستويات دعم/مقاومة:
مستخرجة من 7 أطر زمنية (H4, H1, M30, ...).
نطاق متوسط (Middle Band):
خط برتقالي يعكس متوسط حركة السعر.
تحليل السيولة:
يعتمد على شموع هايكين أشي وحجم التداول.
Brief Explanation of ABO LANA-M (English):
1. Core Trading Signals:
BUY Signal:
Triggers when market trend shifts from bearish to bullish, with price closing above EMA 9.
SELL Signal:
Activates when trend reverses from bullish to bearish, with price closing below EMA 9.
2. Supply/Demand Zones:
Supply Zones (Red):
Key resistance levels plotted at swing highs.
Demand Zones (Green):
Key support levels plotted at swing lows.
Auto-updated based on price action across multiple timeframes.
3. Risk & Profit Management:
Stop Loss (SL):
Calculated using ATR multiplier.
Take Profit Targets (TP1, TP2, TP3):
Three customizable profit levels.
Audio alerts when each target is hit.
4. Smart Dashboard:
Market Trend: Bullish/Bearish across 6 timeframes (1m to Daily).
Momentum Indicator:
Price movement direction over 10 candles.
Custom RSI:
Combines RSI(2) with SMA(7) for smoother readings.
Volume Analysis:
Compares current volume to 20-period average.
Trend Strength (ADX): Strong/Weak.
5. Advanced Features:
Dynamic Trendlines:
Automatically drawn between swing highs/lows.
Support/Resistance Levels:
Extracted from 7 timeframes (H4, H1, M30, etc.).
Middle Band:
Orange line showing price equilibrium.
Liquidity Analysis:
Based on Heikin Ashi candles and volume confirmation.
Phát hành các Ghi chú
MMã nguồn mở
Theo đúng tinh thần TradingView, tác giả của tập lệnh này đã công bố nó dưới dạng mã nguồn mở, để các nhà giao dịch có thể xem xét và xác minh chức năng. Chúc mừng tác giả! Mặc dù bạn có thể sử dụng miễn phí, hãy nhớ rằng việc công bố lại mã phải tuân theo Nội quy.
Thông báo miễn trừ trách nhiệm
Thông tin và các ấn phẩm này không nhằm mục đích, và không cấu thành, lời khuyên hoặc khuyến nghị về tài chính, đầu tư, giao dịch hay các loại khác do TradingView cung cấp hoặc xác nhận. Đọc thêm tại Điều khoản Sử dụng.
Mã nguồn mở
Theo đúng tinh thần TradingView, tác giả của tập lệnh này đã công bố nó dưới dạng mã nguồn mở, để các nhà giao dịch có thể xem xét và xác minh chức năng. Chúc mừng tác giả! Mặc dù bạn có thể sử dụng miễn phí, hãy nhớ rằng việc công bố lại mã phải tuân theo Nội quy.
Thông báo miễn trừ trách nhiệm
Thông tin và các ấn phẩm này không nhằm mục đích, và không cấu thành, lời khuyên hoặc khuyến nghị về tài chính, đầu tư, giao dịch hay các loại khác do TradingView cung cấp hoặc xác nhận. Đọc thêm tại Điều khoản Sử dụng.