OPEN-SOURCE SCRIPT
Correlation Zones
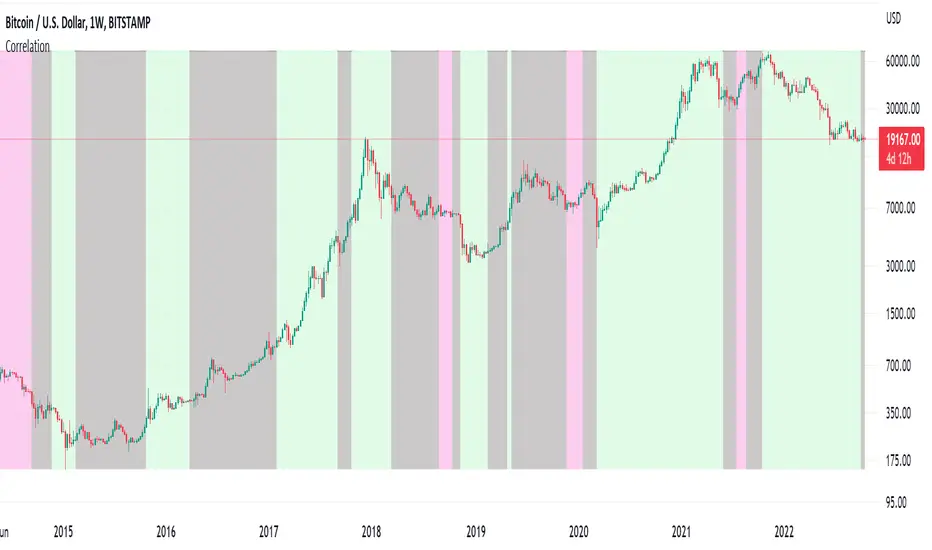
This indicator highlights zones with strong, weak and negative correlation. Unlike standard coefficient indicator it will help to filter out noise when analyzing dependencies between two assets.
With default input setting Correlation_Threshold=0.5:
- Zones with correlation above 0.5, will be colored in green (strong correlation)
- Zones with correlation from -0.5 to 0.5 will be colored grey (weak correlation)
- Zones with correlation below -0.5 will be colore red (strong negative correlation)
Input parameter "Correlation_Threshold" can be modified in settings.
Provided example demonstrates BTCUSD correlation with NASDAQ Composite . I advice to use weekly timeframe and set length to 26 week for this study
Mã nguồn mở
Theo đúng tinh thần TradingView, tác giả của tập lệnh này đã công bố nó dưới dạng mã nguồn mở, để các nhà giao dịch có thể xem xét và xác minh chức năng. Chúc mừng tác giả! Mặc dù bạn có thể sử dụng miễn phí, hãy nhớ rằng việc công bố lại mã phải tuân theo Nội quy.
Thông báo miễn trừ trách nhiệm
Thông tin và các ấn phẩm này không nhằm mục đích, và không cấu thành, lời khuyên hoặc khuyến nghị về tài chính, đầu tư, giao dịch hay các loại khác do TradingView cung cấp hoặc xác nhận. Đọc thêm tại Điều khoản Sử dụng.