PROTECTED SOURCE SCRIPT
Global Market Signals: EMA ROC
Welcome!
Thanks for checking out my indicator.
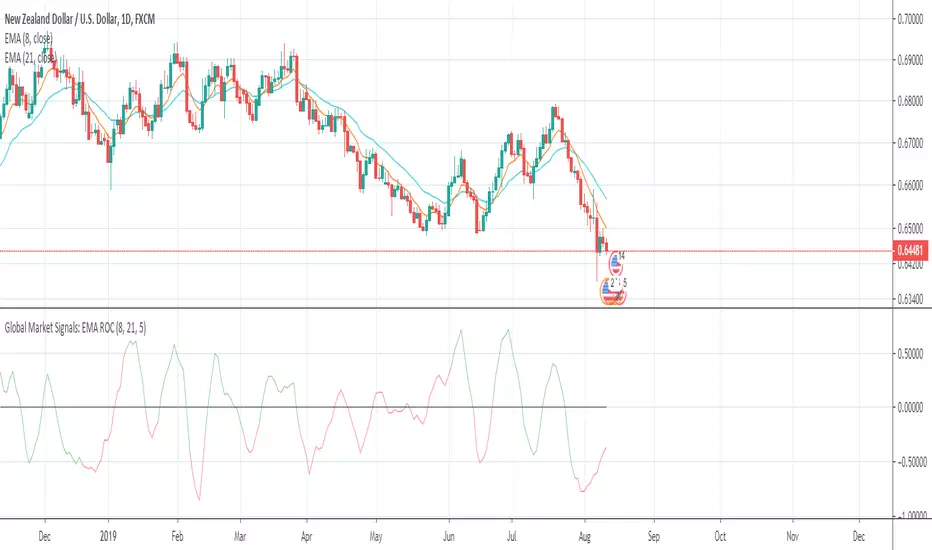
This is the difference in the rate of change between two exponential moving averages.
The colors are green and red:
- Green is when the fast EMA > slow EMA
- Red is when the fast EMA < slow EMA
When the indicator approaches it's upper or lower limits, it will indicate either sideways price movement or a reversal. When the color changes around it's upper or lower limits from green to red or vice-versa, an EMA crossover just occurred and a continuation of trend is possible before a pause or reversal in price.
I hope this helps!
Andre
Global Market Signals
Thanks for checking out my indicator.
This is the difference in the rate of change between two exponential moving averages.
The colors are green and red:
- Green is when the fast EMA > slow EMA
- Red is when the fast EMA < slow EMA
When the indicator approaches it's upper or lower limits, it will indicate either sideways price movement or a reversal. When the color changes around it's upper or lower limits from green to red or vice-versa, an EMA crossover just occurred and a continuation of trend is possible before a pause or reversal in price.
I hope this helps!
Andre
Global Market Signals
Mã được bảo vệ
Tập lệnh này được đăng dưới dạng mã nguồn đóng. Tuy nhiên, bạn có thể sử dụng tự do và không giới hạn – tìm hiểu thêm tại đây.
Thông báo miễn trừ trách nhiệm
Thông tin và các ấn phẩm này không nhằm mục đích, và không cấu thành, lời khuyên hoặc khuyến nghị về tài chính, đầu tư, giao dịch hay các loại khác do TradingView cung cấp hoặc xác nhận. Đọc thêm tại Điều khoản Sử dụng.