OPEN-SOURCE SCRIPT
Cập nhật Exponential Regression Slope Annualized with R-squared Histogram
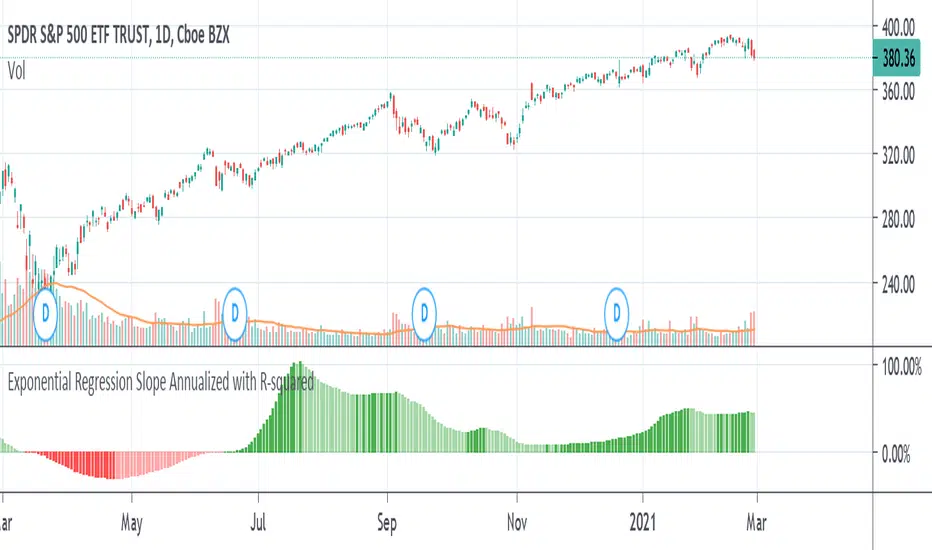
My other indicator shows the linear regression slope of the source. This one finds the exponential regression slope and optionally multiplies it by R-squared and optionally annualizes it. Multiplying by R-squared makes sure that the price movement was significant in order to avoid volatile movements that can throw off the slope value. Annualizing the exponential slope will let you see how much percentage you will make in a year if the price continues at its current pace.
The annualized number is the number of trading days in a year. This and the length might need adjusting for the extra bars that might be in futures or other markets. The number does not have to be a year. For example, it can be a month if you set the number to 20 or so trading days to find how much you would make in a month if price continues at its current pace, etc. This can also be used as an alternative to relative strength or rate of change.
The annualized number is the number of trading days in a year. This and the length might need adjusting for the extra bars that might be in futures or other markets. The number does not have to be a year. For example, it can be a month if you set the number to 20 or so trading days to find how much you would make in a month if price continues at its current pace, etc. This can also be used as an alternative to relative strength or rate of change.
Phát hành các Ghi chú
Changed the default year from 250 to 252, not a big difference.Changed the value to show percentage.
This indicator is like rate of change but lags in order to give less weight to the outliers or the prices that don't fit the exponential regression line.
Mã nguồn mở
Theo đúng tinh thần TradingView, tác giả của tập lệnh này đã công bố nó dưới dạng mã nguồn mở, để các nhà giao dịch có thể xem xét và xác minh chức năng. Chúc mừng tác giả! Mặc dù bạn có thể sử dụng miễn phí, hãy nhớ rằng việc công bố lại mã phải tuân theo Nội quy.
Thông báo miễn trừ trách nhiệm
Thông tin và các ấn phẩm này không nhằm mục đích, và không cấu thành, lời khuyên hoặc khuyến nghị về tài chính, đầu tư, giao dịch hay các loại khác do TradingView cung cấp hoặc xác nhận. Đọc thêm tại Điều khoản Sử dụng.