PROTECTED SOURCE SCRIPT
Cập nhật Session Highs & Lows
Title:
Session Highs & Lows — Asia, London, New York + NY Open Line
Description:
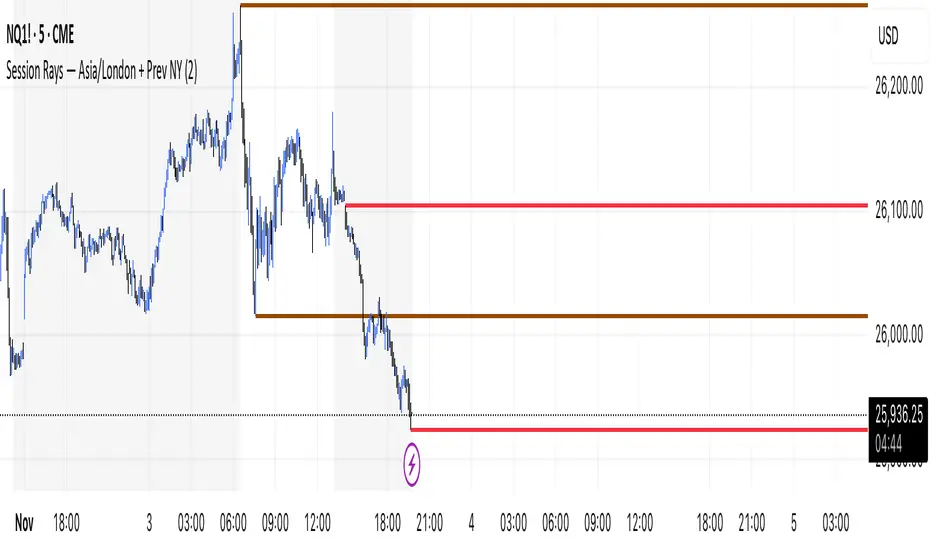
This indicator automatically plots the session highs and lows for the three major trading sessions:
Asia (5 PM – 2 AM PT) – red rays
London (12 AM – 9 AM PT) – blue rays
Previous New York Session (6:30 AM – 1 PM PT) – brown rays
It also draws a thin dashed red line at 6:30 AM PT, marking the New York open.
The script dynamically updates each session’s range as price action unfolds, then locks it in when the session closes.
Lines extend to the right only (“rays”) so traders can easily identify liquidity zones, previous highs/lows, and intraday reaction points without cluttering the left side of the chart.
The logic uses TradingView’s session-time functions (time() windows) and resets automatically after each New York session ends, ensuring that only the current day’s structure is visible.
Unique features:
Works on any timeframe and any symbol (optimized for ES & NQ futures).
Separate colors for each session for clear visual distinction.
Session lines are “live” during the session and freeze once it closes.
Lightweight code with automatic cleanup — avoids line-count overflow.
Non-repainting and fully timezone-aware.
How to use:
Add the indicator to your chart and select your preferred timezone.
Watch how Asia and London session highs/lows guide liquidity during the New York session open (marked by the red dashed line).
Session Highs & Lows — Asia, London, New York + NY Open Line
Description:
This indicator automatically plots the session highs and lows for the three major trading sessions:
Asia (5 PM – 2 AM PT) – red rays
London (12 AM – 9 AM PT) – blue rays
Previous New York Session (6:30 AM – 1 PM PT) – brown rays
It also draws a thin dashed red line at 6:30 AM PT, marking the New York open.
The script dynamically updates each session’s range as price action unfolds, then locks it in when the session closes.
Lines extend to the right only (“rays”) so traders can easily identify liquidity zones, previous highs/lows, and intraday reaction points without cluttering the left side of the chart.
The logic uses TradingView’s session-time functions (time() windows) and resets automatically after each New York session ends, ensuring that only the current day’s structure is visible.
Unique features:
Works on any timeframe and any symbol (optimized for ES & NQ futures).
Separate colors for each session for clear visual distinction.
Session lines are “live” during the session and freeze once it closes.
Lightweight code with automatic cleanup — avoids line-count overflow.
Non-repainting and fully timezone-aware.
How to use:
Add the indicator to your chart and select your preferred timezone.
Watch how Asia and London session highs/lows guide liquidity during the New York session open (marked by the red dashed line).
Phát hành các Ghi chú
🧭 Description (for the “Script description” field)This indicator automatically plots session highs and lows for the three major global trading sessions:
Asia Session (16:00 → 01:00 chart time) — red rays
London Session (00:00 → 09:00 chart time) — blue rays
Previous New York Session (06:30 → 13:00 chart time) — brown rays
It also draws a thin dashed vertical red line at 06:30 to mark each New York open.
All rays extend to the right only, so you can easily track current liquidity zones without clutter on the left side of the chart.
⚙️ How it works
Uses TradingView’s built-in time() function to detect session windows in your chart timezone.
Tracks live highs and lows during the session, then locks them once the session closes.
Resets automatically at the start of the Asia session each day, so you always see only the current day’s Asia and London levels and the most recent completed New York session.
Designed for any timeframe and any symbol (optimized for ES & NQ futures).
✨ Unique features
Dynamic, real-time tracking of highs / lows (“snaps to wicks”).
Automatic daily cleanup to prevent old lines from lingering.
Distinct colors for each session with fixed global market hours.
Optional 06:30 NY Open line for intraday alignment.
Lightweight and non-repainting.
🧩 Usage
Add the indicator to your chart and keep your chart timezone set to the market you trade (e.g., America/Los_Angeles for PST).
Use the color-coded session highs and lows to identify liquidity zones, range breaks, and confluence levels across sessions.
Phát hành các Ghi chú
📘 Title:Session Highs & Lows — Asia (Red), London (Blue), and Previous New York (Brown)
🧭 Description:
This indicator automatically marks the session highs and lows for the three main global trading sessions, helping traders easily visualize intraday liquidity and range boundaries.
Asia Session (16:00 → 01:00) → Red horizontal rays
Updates dynamically during the Asia session.
Locks and remains once the session closes.
London Session (00:00 → 09:00) → Blue horizontal rays
Tracks live London highs and lows.
Resets daily at London open.
Previous New York Session (06:30 → 13:00) → Brown horizontal rays
Displays the completed New York session’s high and low from the previous trading day.
Useful for identifying carry-over liquidity zones and daily bias reference points.
Each session’s high and low are drawn as thin, right-extended horizontal rays that “snap” to candle wicks.
Older session lines are automatically cleared at the start of the new Asia session, keeping your chart clean and relevant.
⚙️ How it works:
Uses time() session windows that follow your chart’s timezone (set your TradingView chart to your local or exchange timezone).
Tracks new highs/lows in real time during the session, and locks them once the session ends.
Works on any timeframe or symbol — optimized for futures traders (e.g., ES, NQ) and FX markets.
Lightweight, non-repainting, and self-resetting daily.
✨ Unique features:
Color-coded clarity (Red = Asia, Blue = London, Brown = Previous NY).
Right-extended rays that highlight liquidity levels without cluttering the chart’s past.
Auto-reset logic — only today’s Asia and London sessions plus the most recent completed New York remain visible.
🧩 Usage:
Add the indicator to your chart and keep your chart’s timezone consistent.
Use the colored session levels to spot range expansions, reversals, or liquidity sweeps between sessions — a key tool for session-based trading models.
Mã được bảo vệ
Tập lệnh này được đăng dưới dạng mã nguồn đóng. Tuy nhiên, bạn có thể sử dụng tự do và không giới hạn – tìm hiểu thêm tại đây.
Thông báo miễn trừ trách nhiệm
Thông tin và các ấn phẩm này không nhằm mục đích, và không cấu thành, lời khuyên hoặc khuyến nghị về tài chính, đầu tư, giao dịch hay các loại khác do TradingView cung cấp hoặc xác nhận. Đọc thêm tại Điều khoản Sử dụng.